Chapter 4A: EDA — Descriptive Findings & ARC Risk Factors
Chapter 4A: EDA — Descriptive Findings & ARC Risk Factors
Descriptive statistics and distributional analysis of the At-Risk Coefficient (ARC) dataset for school year 2023-2024. Covers 8,674 campuses across 1,203 districts. Examines risk factor distributions, inter-factor correlations, outcome variable relationships, and funding patterns to establish the empirical foundation for the constitutional efficiency analysis.
The ARC analysis draws from a dataset of 8,674 Texas public school campuses in the 2023-24 PEIMS reporting year, spanning 1,203 districts, including 906 open-enrollment charter campuses and 7,768 traditional ISD campuses (Texas Education Agency, 2024). TEA classifies campuses into groups for elementary (N = 4,594), middle school including junior high (N = 1,664), and high school (N = 1,565). Eight risk factor variables drawn from the statutory at-risk criteria under TEC §29.081 serve as independent variables. Chronic absenteeism, defined as missing 10% or more of enrolled school days, serves as the dependent variable.
Economic disadvantage is the dominant risk factor at the elementary level. The mean campus proportion of economically disadvantaged students is 67.4% at elementary campuses and 62.9% at secondary campuses (Texas Education Agency, 2024). English Language Learner status averages 27.7% at elementary campuses and 20.3% at secondary campuses. The decline across school levels is consistent with English acquisition reducing ELL classification as students advance. Academic underperformance averages 25.7% at secondary campuses. One in four secondary students meets at least one of the criteria listed under TEC §29.081(d). Those criteria include failure to advance to the next grade level, failure to maintain a 70 average in two or more subjects, and failure to perform satisfactorily on state assessments.
The ARC regression uses separate models for each school level. The elementary model (N = 4,594) achieves an R² of 0.40, with economic disadvantage as the dominant predictor (β = 0.40). The middle school model (N = 1,664) scores the highest R² of any level at 0.46. Discipline (measured as DAEP placement under TEC §37.006) and academic underperformance are co-dominate at the middle school level (β = 0.33 and β = 0.34). The high school model (N = 1,565), yields an R² of 0.32, revealing academic underperformance as the dominant predictor of chronic absenteeism (β = 0.45). These three distinct risk profiles show how student risk factors change with age. A single compensatory weight applied uniformly across all three levels cannot account for these differences.
TEA suppresses student counts below 10 per campus for each risk factor in order to comply with FERPA (20 U.S.C. §1232g). Pregnancy data is masked at 82.6% of secondary campuses, homeless data is masked at 50.9% of campuses, and foster care data is masked at 40.9% (Texas Education Agency, 2024). The masking creates a downward bias in ARC scores for small campuses. A campus with 50 students and 8 homeless students has a true homeless proportion of 16%, but FERPA masks that count to zero because 8 is below the threshold. Conversely, a campus with 500 students and 15 homeless students would be unmasked and retain its 3% value. The ARC model treats all masked values as zero. Excluding campuses with any masked factor would reduce the high school sample from 1,565 to approximately 370, a 76% loss. An unmasked validation using Austin ISD Student Information System data (108 campuses, 2024-25, 0% FERPA masking) produced R² = 0.73 for elementary (N = 77), 0.74 for middle school (N = 19), and 0.89 for the high school reduced model (N = 12). In the unmasked middle school model, homelessness became the dominant predictor of chronic absenteeism, a factor masked at 50.9% of campuses statewide. Discipline and homelessness both reached significance in the unmasked high school model where FERPA suppression had obscured their contributions. The statewide masked models achieve R² = 0.40, 0.46, and 0.32 at the same three levels. FERPA suppression accounts for the difference.
TEA reports dropout data for 2,087 secondary campuses in 2023-24. Of those, 780 campuses (37.4%) report exactly 0.0% dropout rate (Texas Education Agency, 2024). The zero rate correlates with campus size. Among campuses with 200 or fewer students, 56.5% report zero dropout. Among campuses with more than 2,000 students, only 5.1% report zero. TEA masks any student count below 10 to zero under FERPA (20 U.S.C. §1232g). A campus with 200 students needs only 10 dropouts to clear the threshold. A campus with 2,000 students needs the same 10. Gubbels, van der Put, and Assink (2019) identified chronic absenteeism as the strongest single predictor of eventual dropout (pooled effect size d = 0.82). In the Texas data, 113 campuses report zero dropout and simultaneous chronic absenteeism rates at or above 10%. One in ten students at these campuses misses 10% or more of enrolled school days. Zero of those students are recorded as dropping out. FERPA masking or administrative reclassification of dropout events accounts for both the size correlation and the 113 zero-dropout, high-absenteeism campuses.
Two high school ARC models were fit on Texas PEIMS data using OLS regression. Both models use the same eight risk-factor predictors. The risk factors were selected based on Gubbels et al.'s (2019) meta-analytic review of dropout and absenteeism predictors and derived from using TEC §29.081 statutory criteria. The dropout model (R² = 0.445, N = 2,087) produces two wrong-sign coefficients. Economic disadvantage has a negative standardized beta (β = -0.034, p = 0.106). Discipline has a negative standardized beta (β = -0.137, p < 0.001). Higher poverty predicting lower dropout and more DAEP placements predicting fewer dropouts are both artifacts of the FERPA zero-inflation documented above. The chronic absenteeism model (R² = 0.306, N = 2,067) produces correct-sign coefficients for all significant factors. Academic underperformance is the dominant predictor (β = 0.425, p < 0.001). Discipline is second (β = 0.212, p < 0.001). Economic disadvantage is third (β = 0.102, p < 0.001). Chronic absenteeism is not subject to FERPA small-count suppression and does not exhibit the zero-inflation that distorts the dropout distribution. Chronic absenteeism is used as the dependent variable for all three school-level ARC models.
The correlation matrix, computed from 1,884 campuses with complete data on all seven factors, reveals three groupings (Texas Education Agency, 2024). Economic disadvantage, academic underperformance, and chronic absenteeism form a strongly correlated triad (pairwise r = 0.59 to 0.65). ELL correlates moderately with economic disadvantage (r = 0.61) but weakly with chronic absenteeism (r = 0.10). Foster care shows a near-zero correlation with all other factors (|r| < 0.08), indicating that students in state conservatorship tend to have high attendance rates despite the distinct risk profile. The statutory compensatory weight under TEC §48.104 applies a census-block tiered multiplier (0.225-0.275 under HB 3, anchored at the 1984 baseline of 0.20) to the economically disadvantaged headcount regardless of what other risk factors co-occur at a campus. Two campuses illustrate this point. Martin Middle School in Austin ISD (N = 240) and Rick Schneider Middle School in Pasadena ISD (N = 517) both report economically disadvantaged rates of 92.5% in 2023-24. Under post-HB 3 §48.104, both campuses generate the same compensatory funding per economically disadvantaged student. At the statewide average tier weight, that comes to roughly $1,540 (0.25 × $6,160). The difference is in their at-risk profile. Martin serves the Salvation Army Women and Children's Shelter. Its chronic absenteeism rate is 20.0%, its academic underperformance rate is 60.0%, and its DAEP discipline rate is 9.17%. Schneider reports 6.9% chronic absenteeism, 24.0% academic underperformance, and 6.19% discipline. Unmasked Austin ISD Student Information System data reports 10% homeless at Martin in 2024-25 (Austin ISD, 2025). The three-bucket ARC middle school model gives Martin a recalibrated score of 44.69 and Schneider a score of 34.25. Both campuses receive identical compensatory funding despite the 30% ARC gap between them.
Charter campuses report higher mean rates across all four major risk factors than ISD campuses statewide. The mean economically disadvantaged rate at charter campuses is 74.4%, compared to 65.4% at ISD campuses. Charter ELL rates average 32.7% versus 25.4% at ISDs. Chronic absenteeism averages 7.8% at charter campuses and 6.5% at ISDs. Academic underperformance averages 26.8% at charters versus 23.5% at ISDs (Texas Education Agency, 2024). Charter campuses constitute 10.4% of the state's campuses, 906 of 8,674. These numbers reflect where charter operators locate in Texas. Open-enrollment charters concentrate in high-poverty urban communities (Houston, Dallas, San Antonio, the Rio Grande Valley) rather than affluent suburban districts. The statewide demographic gap between charter and ISD campuses is a product of that geographic targeting. Fuller (2014) and Bifulco and Ladd (2007) documented a different pattern at the metropolitan level: within the same community, charter schools enrolled lower proportions of special education and ELL students than neighboring district schools. Both patterns can operate simultaneously. Charter operators target high-poverty communities but may enroll less costly students within those communities. The demographic gap produces a corresponding gap in ARC scores: charter elementary campuses average 17.864 versus 15.565 for ISDs (Texas Education Agency, 2024). The Foundation School Program provides a flat per-pupil basic allotment of $6,160 per student in average daily attendance, adjusted by the Cost of Education Index (TEC §48.051). The compensatory education allotment (TEC §48.104) adds a supplemental weight (0.20 baseline under HB 72 (1984), nominally tiered to 0.225-0.275 by HB 3 (2019)) per economically disadvantaged student, regardless of what other risk factors co-occur at the campus. Campuses with ARC scores of 17 and campuses with ARC scores of 11 generate similar compensatory funding if their economically disadvantaged counts are comparable. Toutkoushian and Michael (2007) defined vertical equity as funding that accounts for 'varying pupil characteristics' (p. 187). The IDRA called for this as well in its 1975 "17 Elements for an Equitable School Finance System" (Cárdenas, 1997). The flat compensatory weight does not meet that standard.
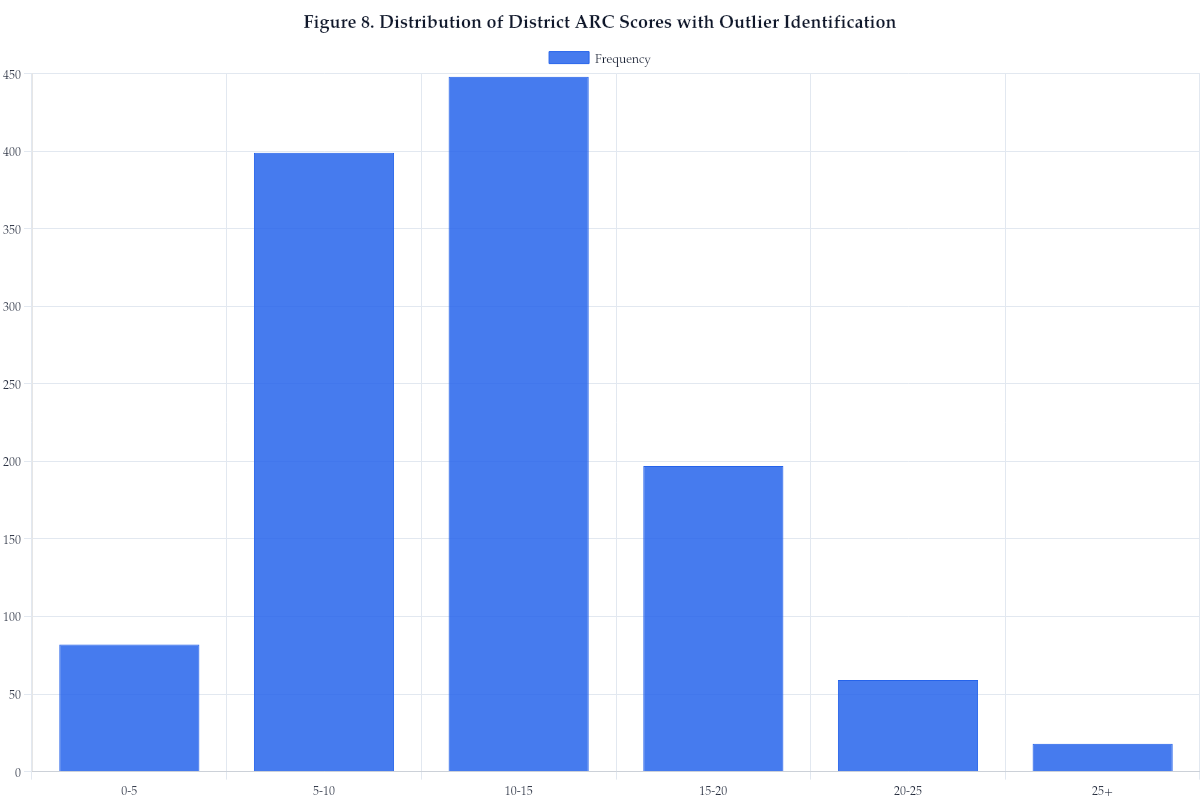
At the district level, 1,203 districts have calculated ARC scores. The mean district ARC is 12.035, and the range is 0.692 to 32.824 (Texas Education Agency, 2024). Per-pupil operational expenditure has a statewide median of $11,951 (Texas Education Agency, 2024). Toutkoushian and Michael (2007) tested whether districts with greater student need receive proportionally greater funding, while Templeton, Selsberg, Abdelmalak, and Abdelhamid (2023) applied Gini coefficients to Texas school finance data, showing that HB 3 increased overall inequality, with the Gini rising from 0.124 to 0.146 between 2018-19 and 2021-22. The ARC equity analysis in Section 4E extends these works by using campus-level ARC scores as the need measure and calculating a Spearman rank correlation (rho = -0.239, p < 0.001) and Concentration Index (0.269) across 1,201 districts.
FERPA masking produces lower-bound ARC scores at small campuses, biasing the model against the 56.5% of small secondary campuses where suppression is most prevalent. Unmasked Austin ISD data raises R² from 0.40 to 0.73 at elementary, 0.46 to 0.74 at middle school, and 0.32 to 0.89 at high school. The dropout rate is unreliable as a dependent variable because 37.4% of the secondary sample reports exactly zero, and the regression produces wrong-sign coefficients for economic disadvantage and discipline. Charter operators concentrate in high-poverty urban communities, where 74.4% of charter campus students are economically disadvantaged. The statutory compensatory weight under TEC §48.104 (post-HB 3 tiered 0.225-0.275, anchored at the 1984 baseline of 0.20) applies a multiplier per economically disadvantaged student regardless of how many risk factors overlap at a given campus. ARC shows that campuses with concentrated, co-occurring risk factors require substantially more resources than the flat weight provides. TIA compounds the funding gap at already-advantaged campuses (Section 4B). Within-community demographic sorting concentrates special education costs in ISDs (Section 4C). The bond mechanism fails in districts where the populations with the greatest facility needs are least represented in the electorate (Section 4D). Post-HB 3 tiered weights underestimate empirically derived weights by factors of 2 to 5 across all three school levels (Section 4E).
Table 1. Summary Statistics: ARC Risk Factors (Secondary Campuses, N = 3,772)
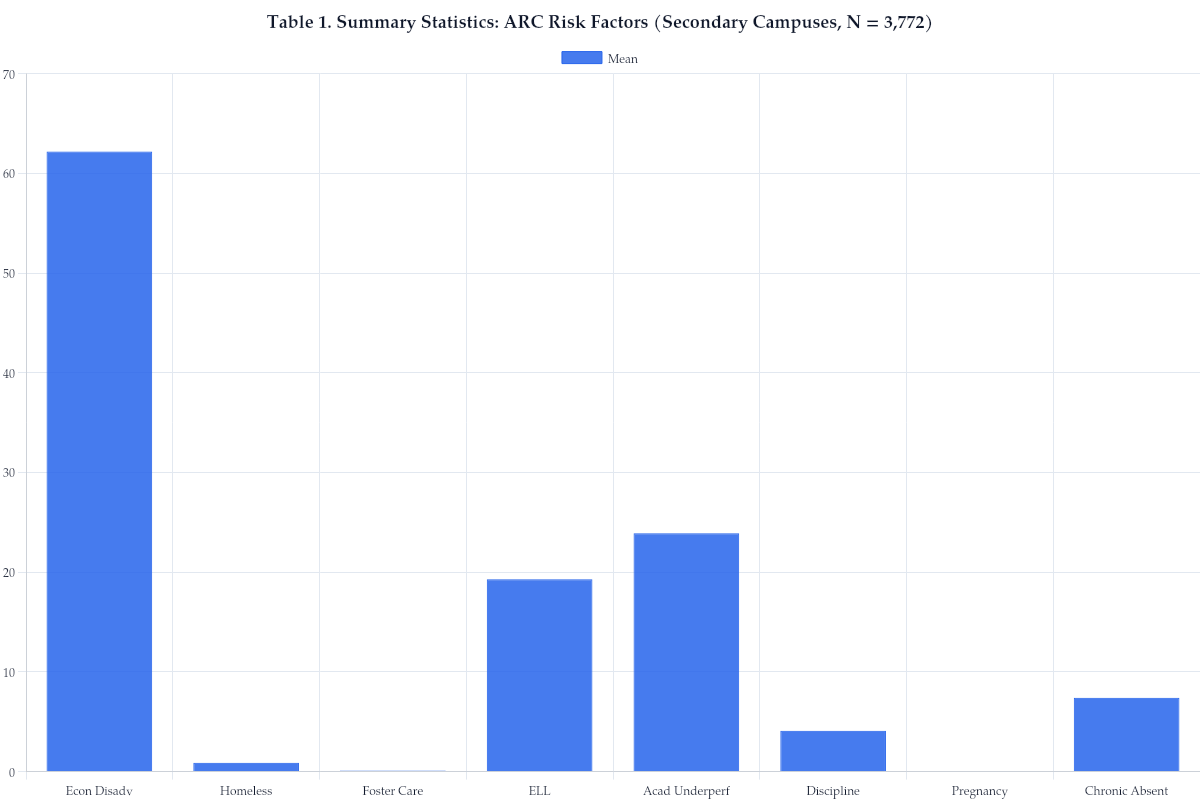
Table 2. Summary Statistics: ARC Risk Factors (Elementary Campuses, N = 4,902)
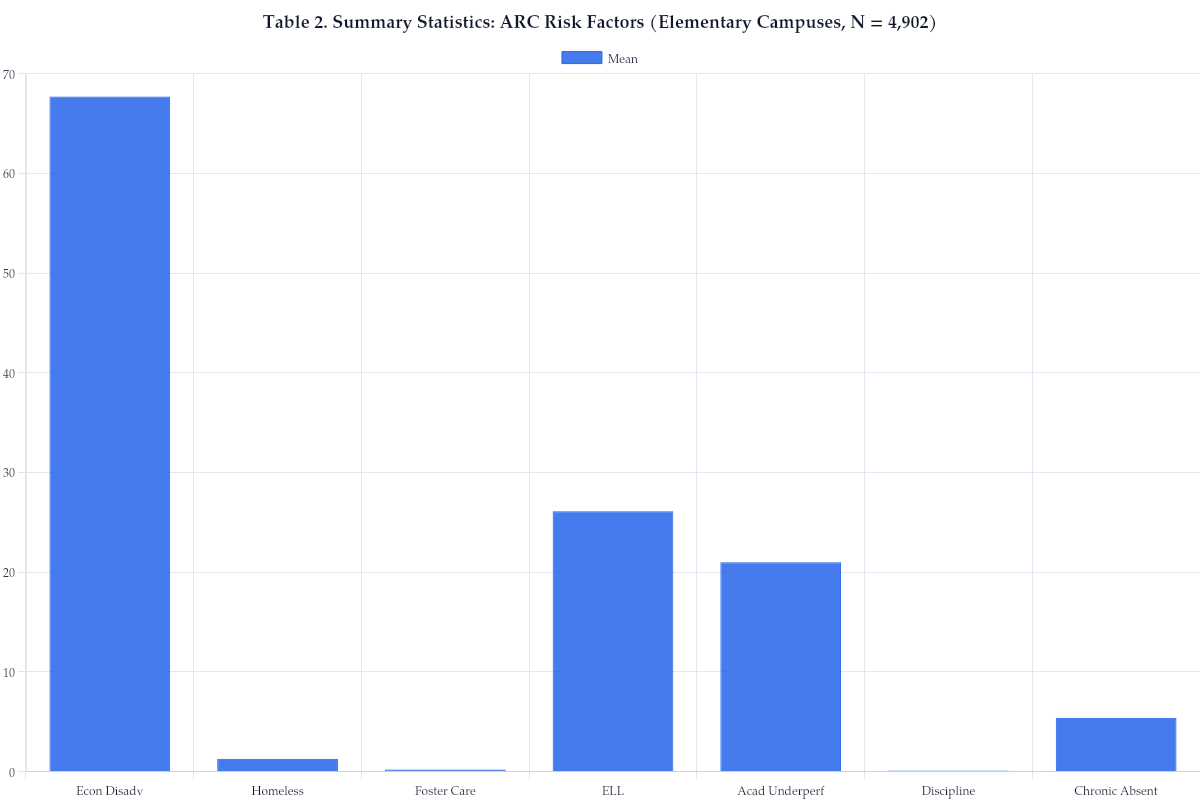
Table 3. Summary Statistics: Outcome and Funding Variables
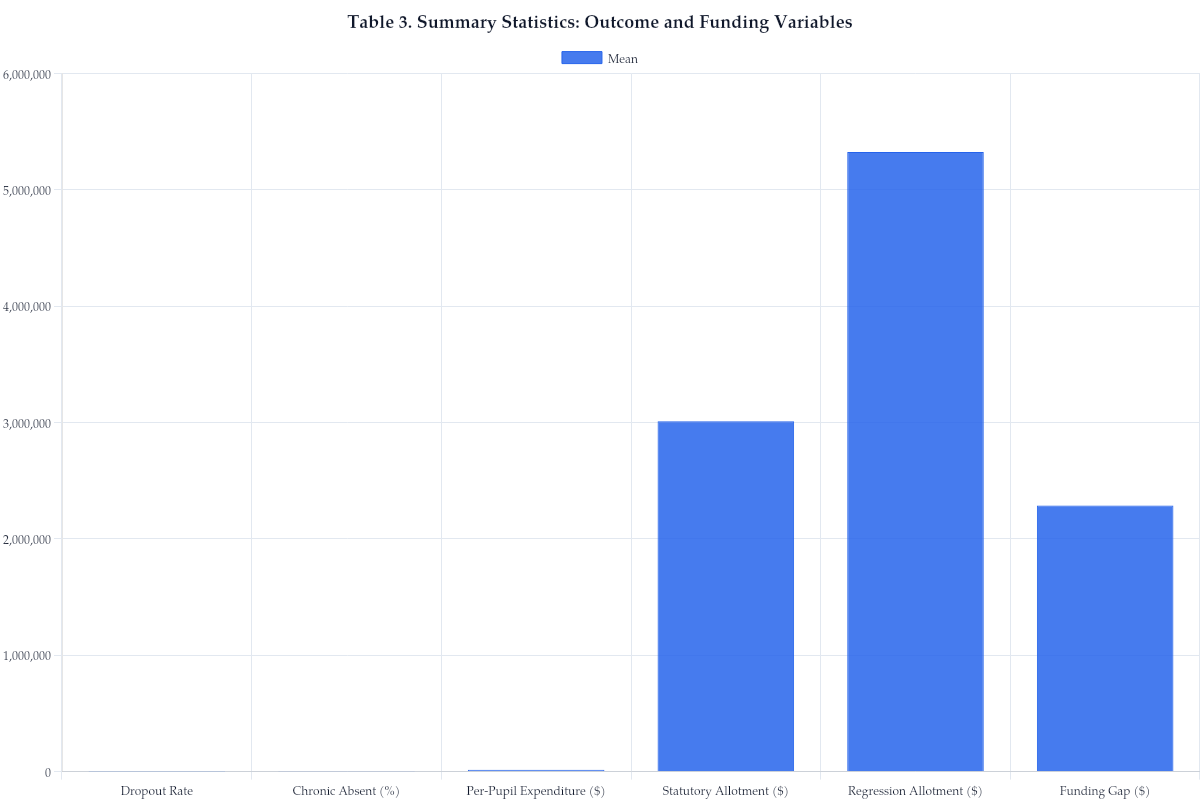
Figure 1. Distribution of ARC Factor Proportions by School Level
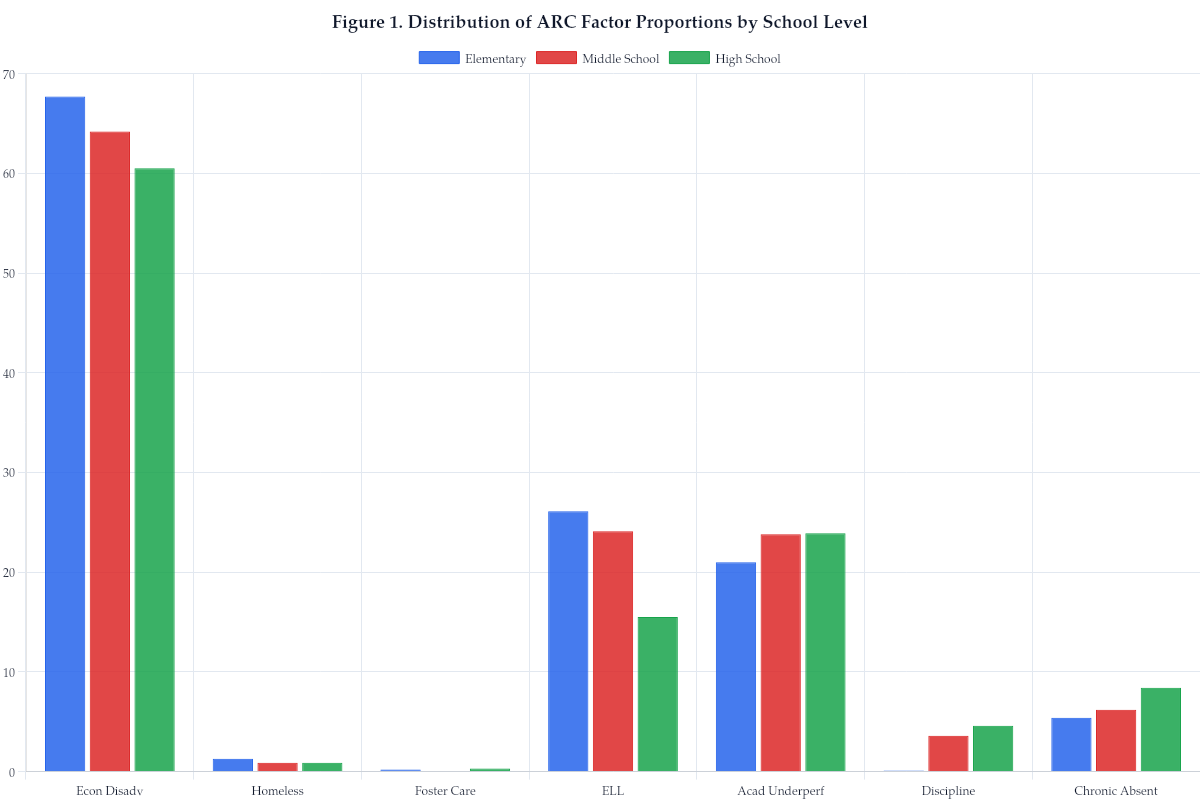
Figure 2. Distribution of Dropout Rate (Secondary Campuses)
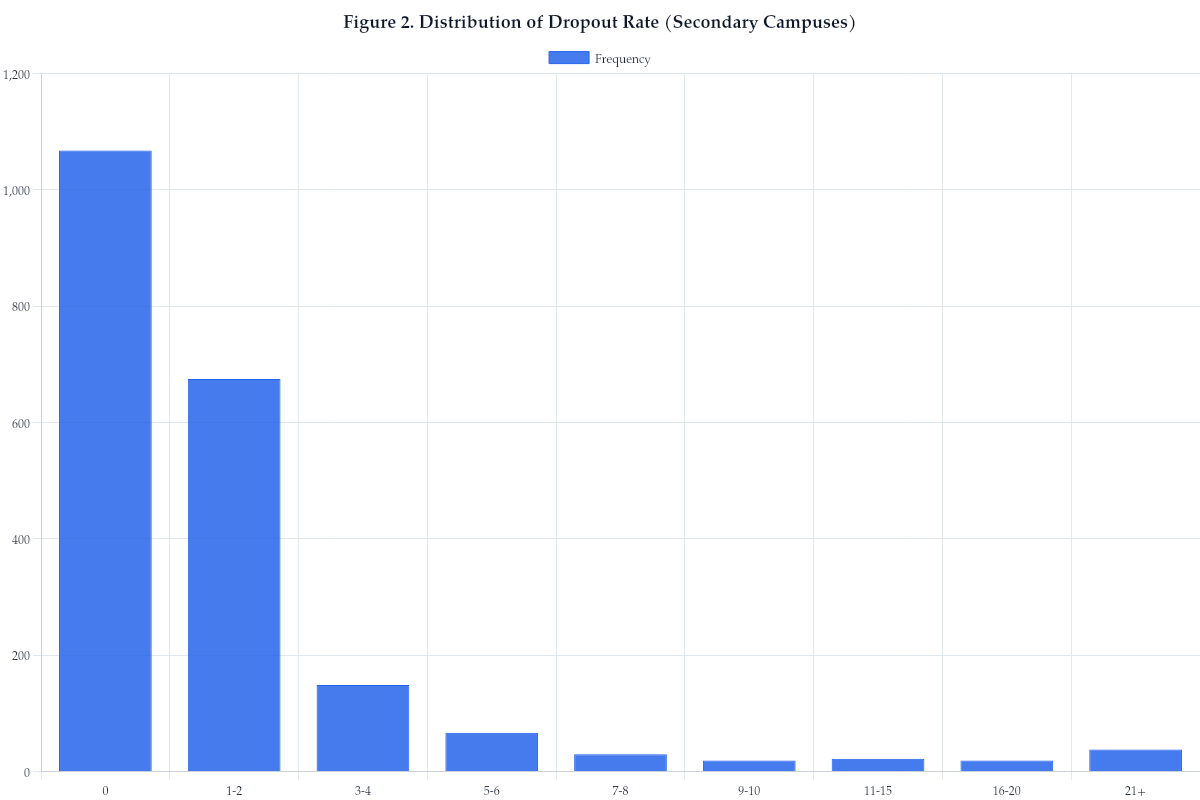
Figure 3. Distribution of Chronic Absenteeism Rate (Elementary Campuses)
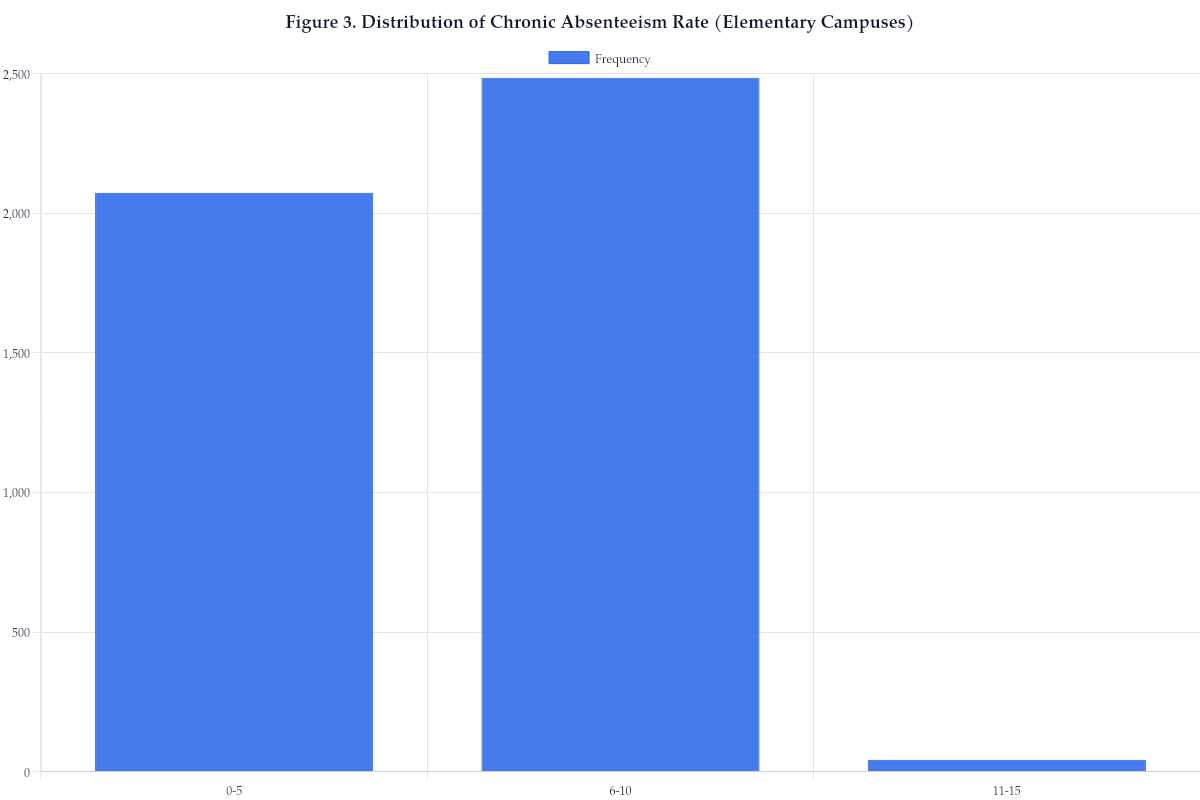
Figure 5. ARC Score vs. Dropout Rate (Secondary Campuses)
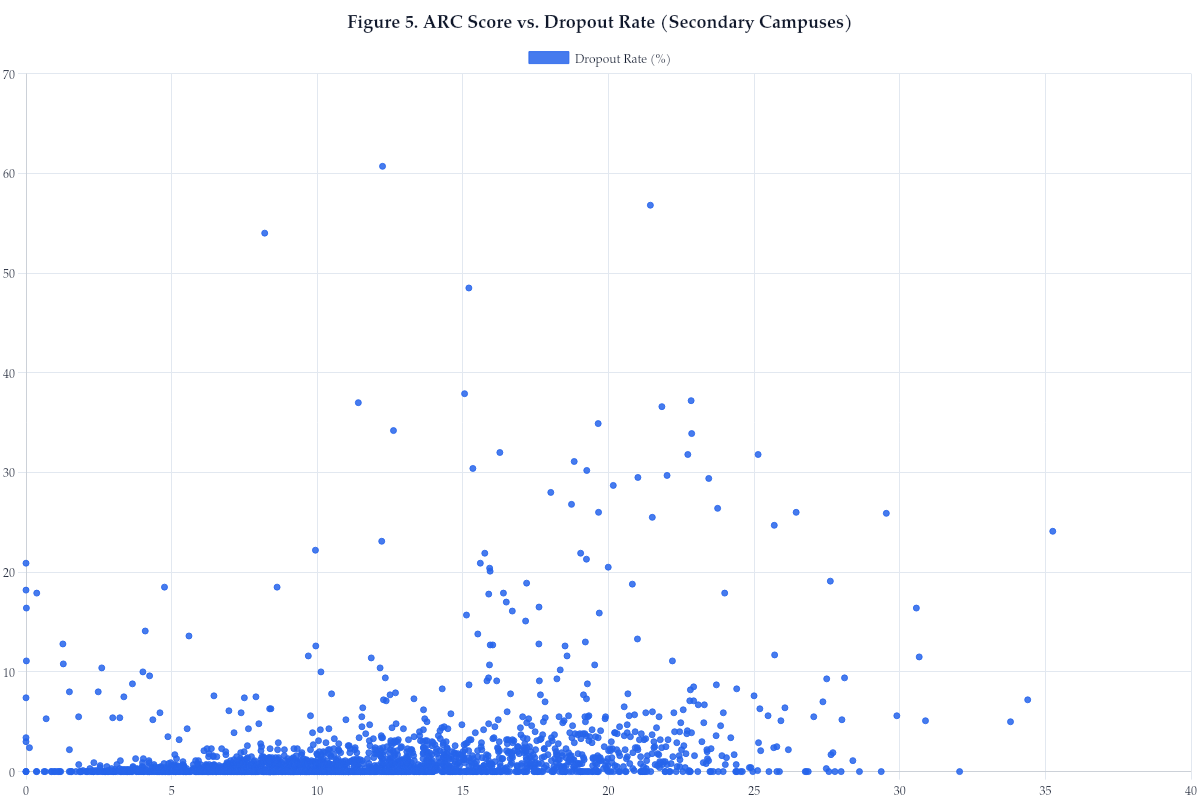
Figure 5a. Dropout Rate Distribution (Secondary Campuses)
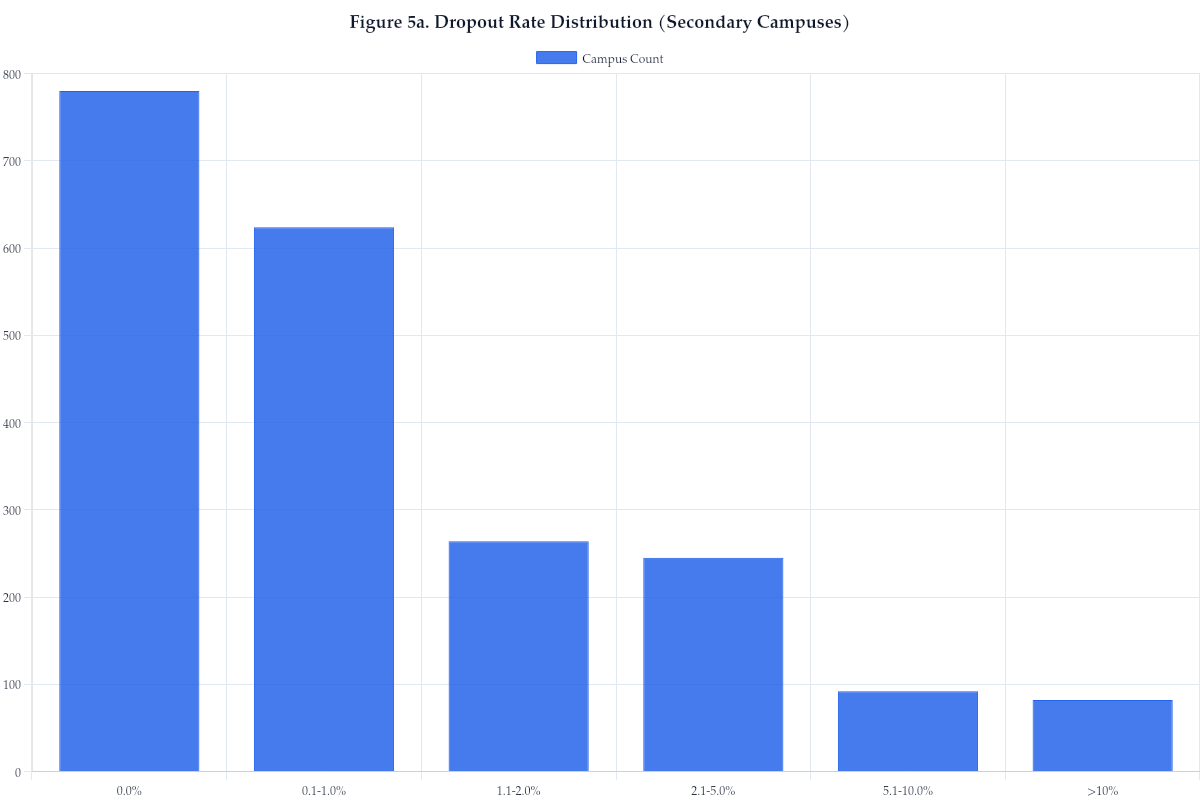
Figure 5b. Zero-Dropout Rate by Campus Size
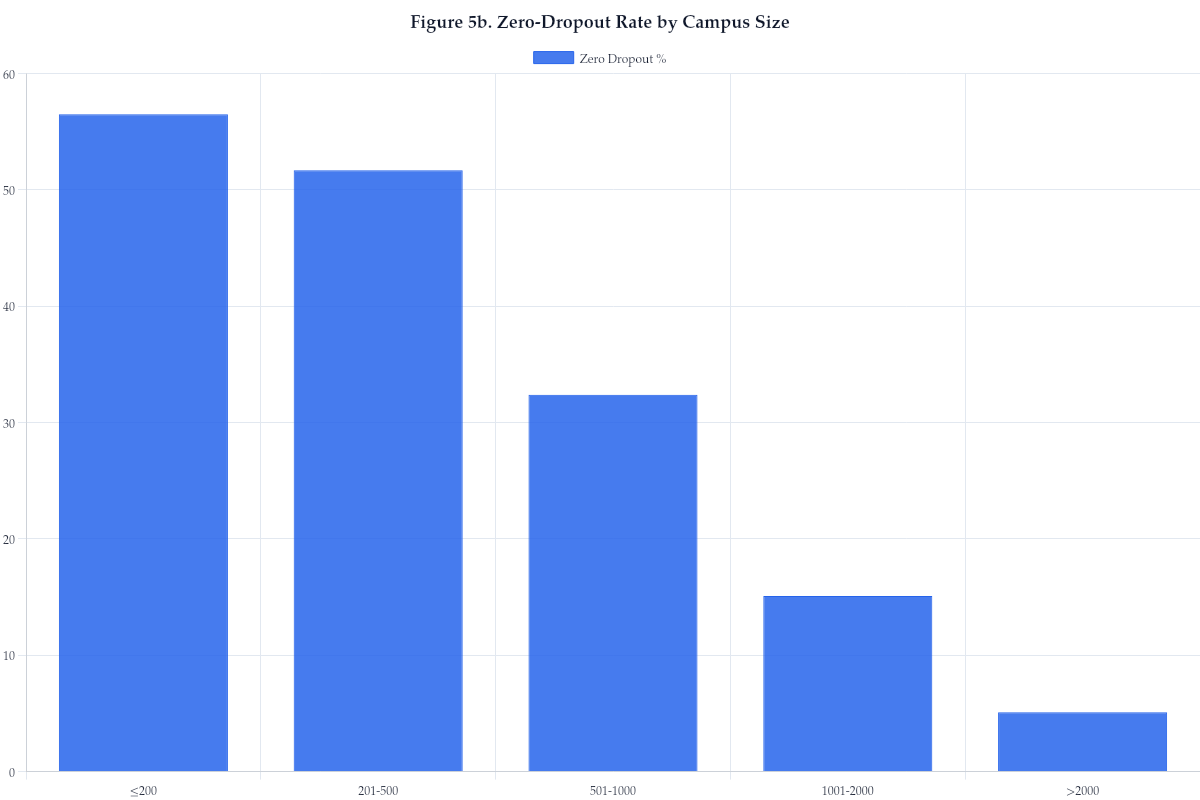
Figure 5c. Chronic Absenteeism at Zero-Dropout Campuses
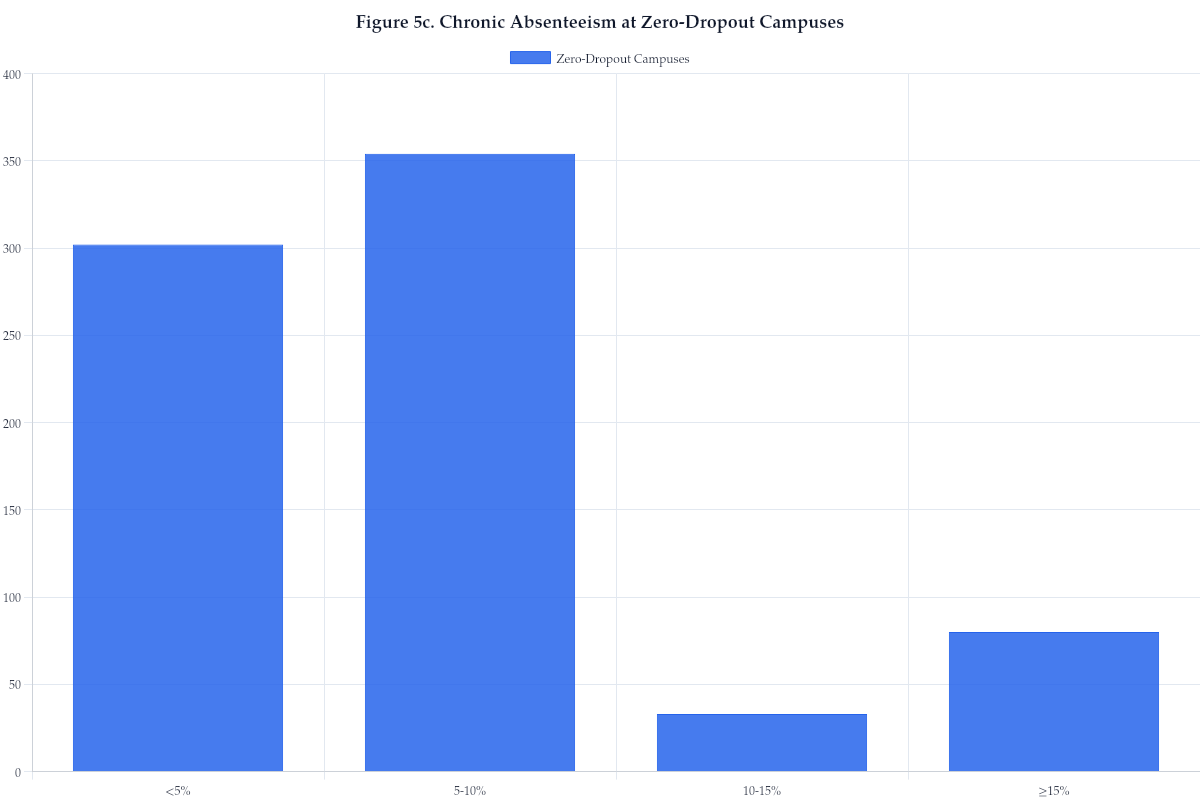
Figure 6. ARC Score vs. Chronic Absenteeism (Elementary Campuses)
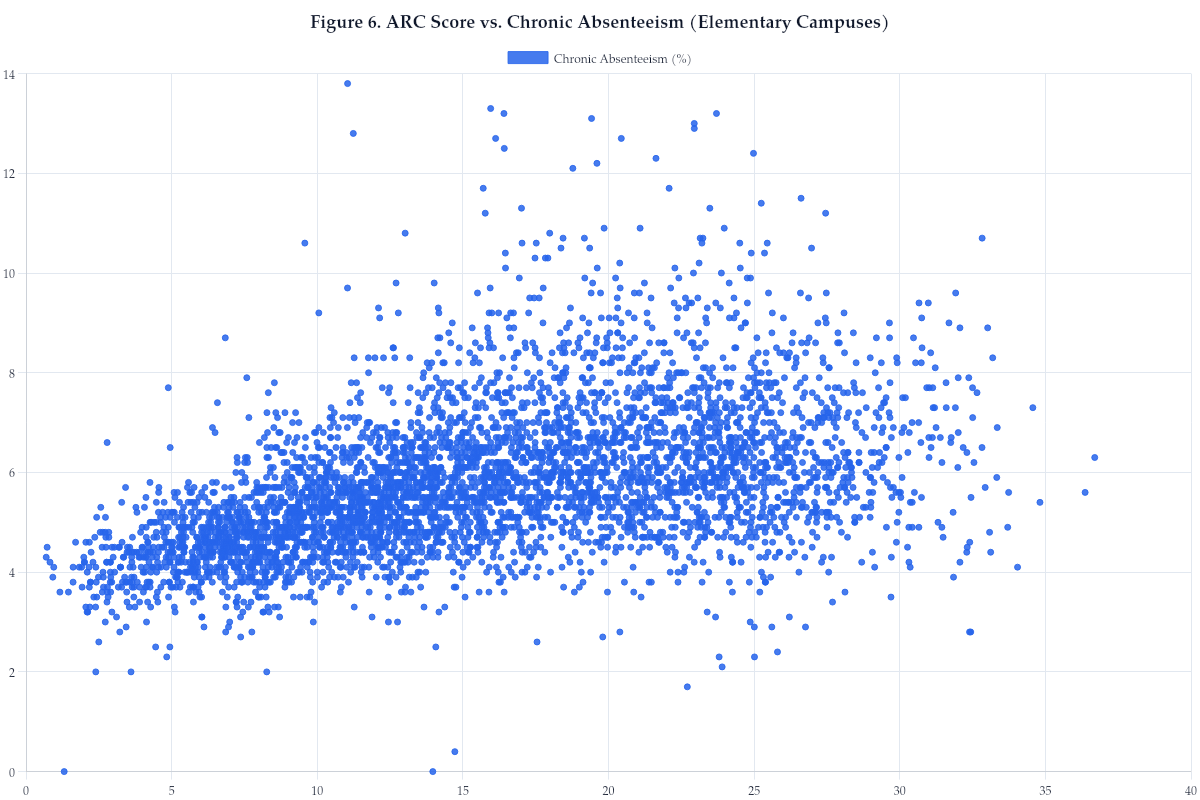
Figure 7. District ARC Score vs. Per-Pupil Expenditure
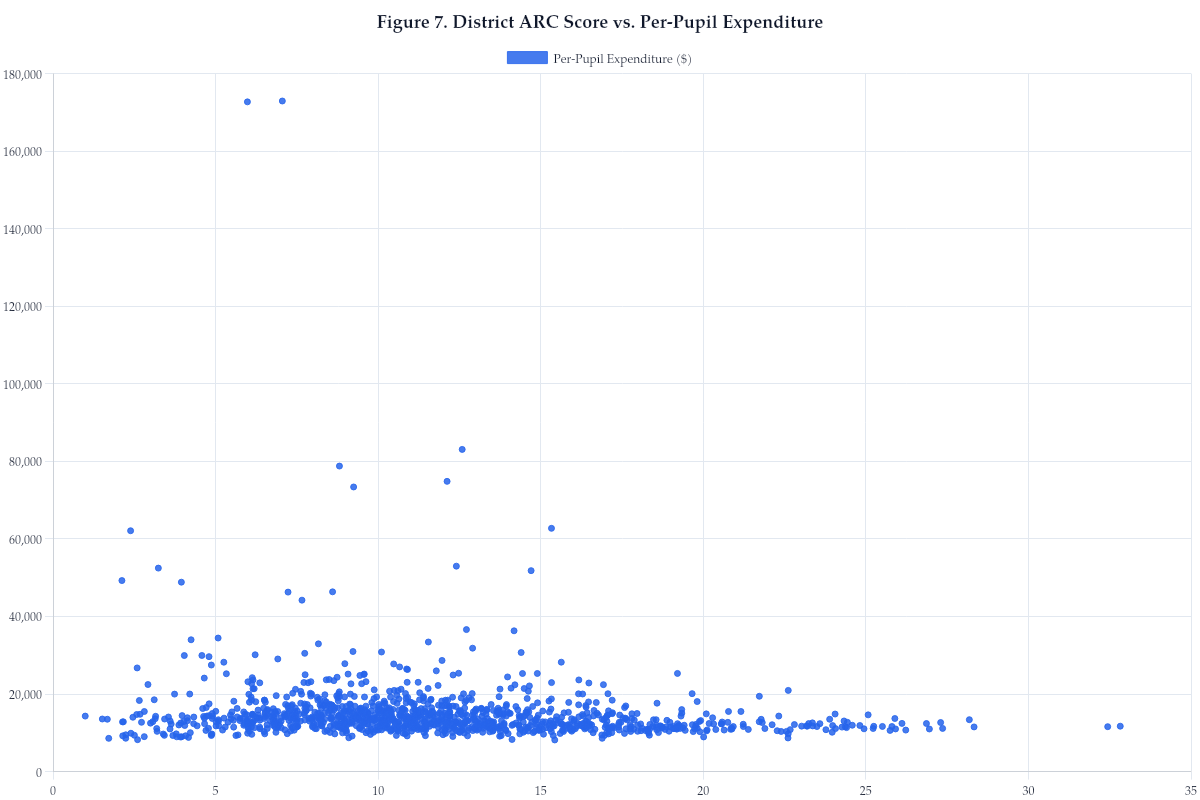
Figure 8. Distribution of District ARC Scores with Outlier Identification