Chapter 4C: Austin Area — Charter/ISD Duplication
Chapter 4C: Austin Area — Charter/ISD Duplication
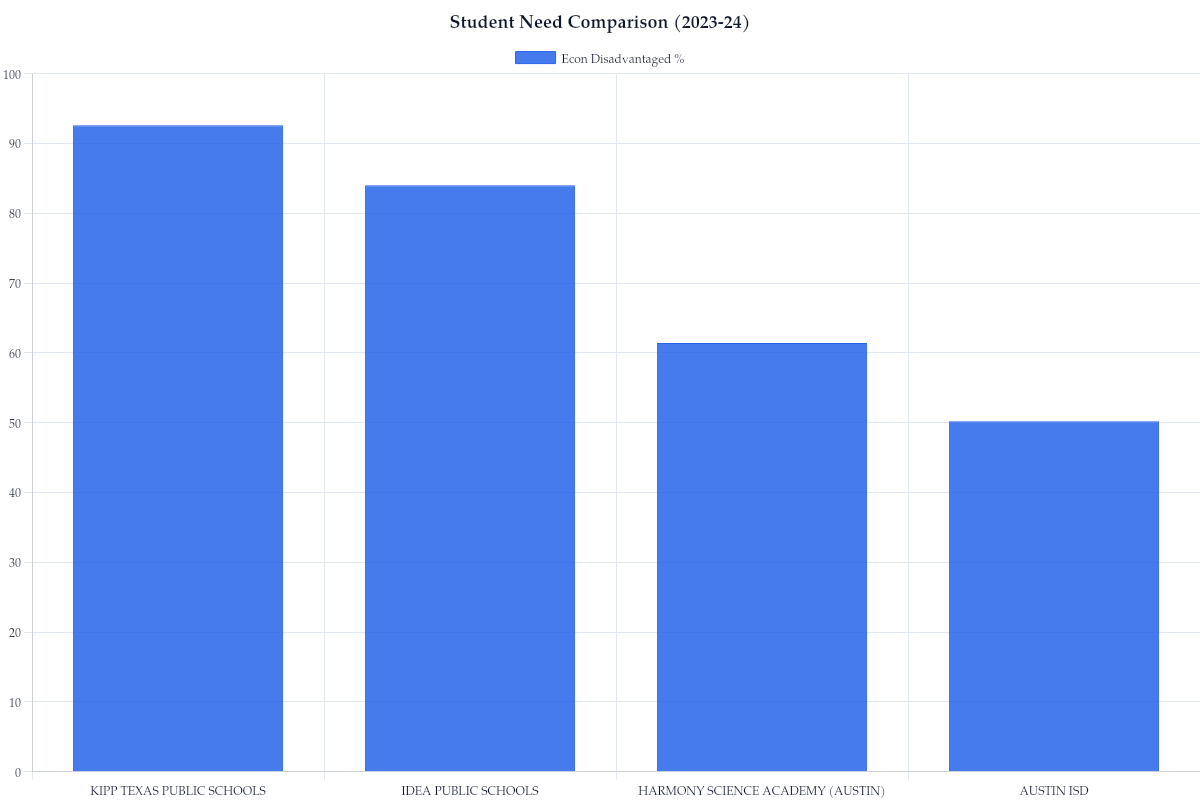
Examines charter school duplication and its fiscal impact on Austin ISD under the Art. VII §1 'efficient system' standard. Compares Austin ISD with KIPP Texas, Harmony Austin, and IDEA Public Schools across student demographics, enrollment trends, workforce stability, and funding structure.
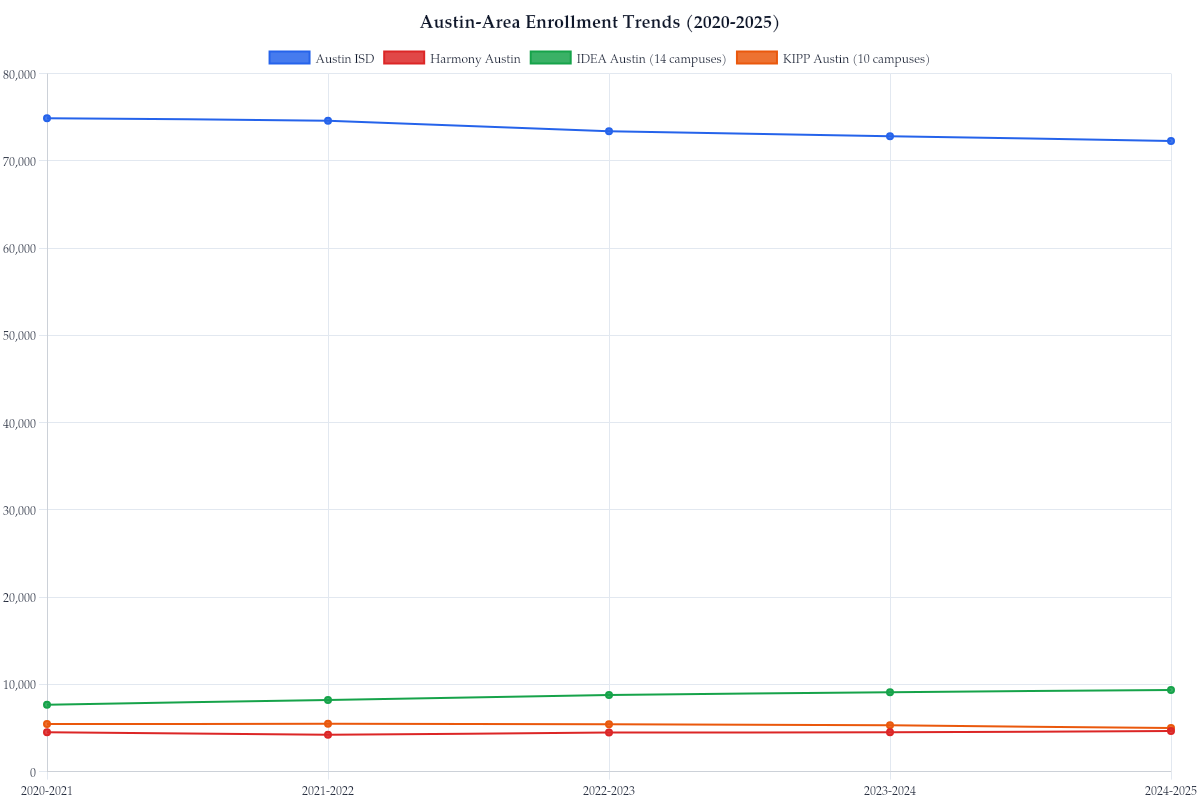
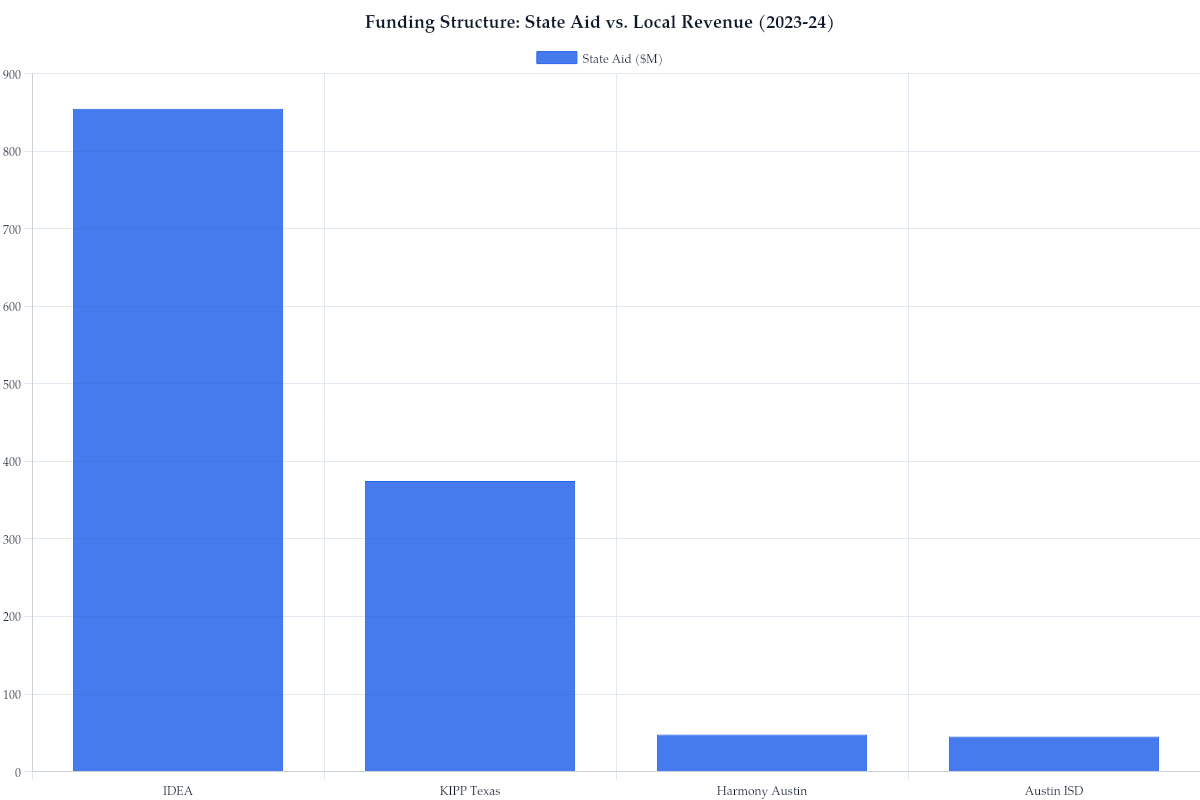
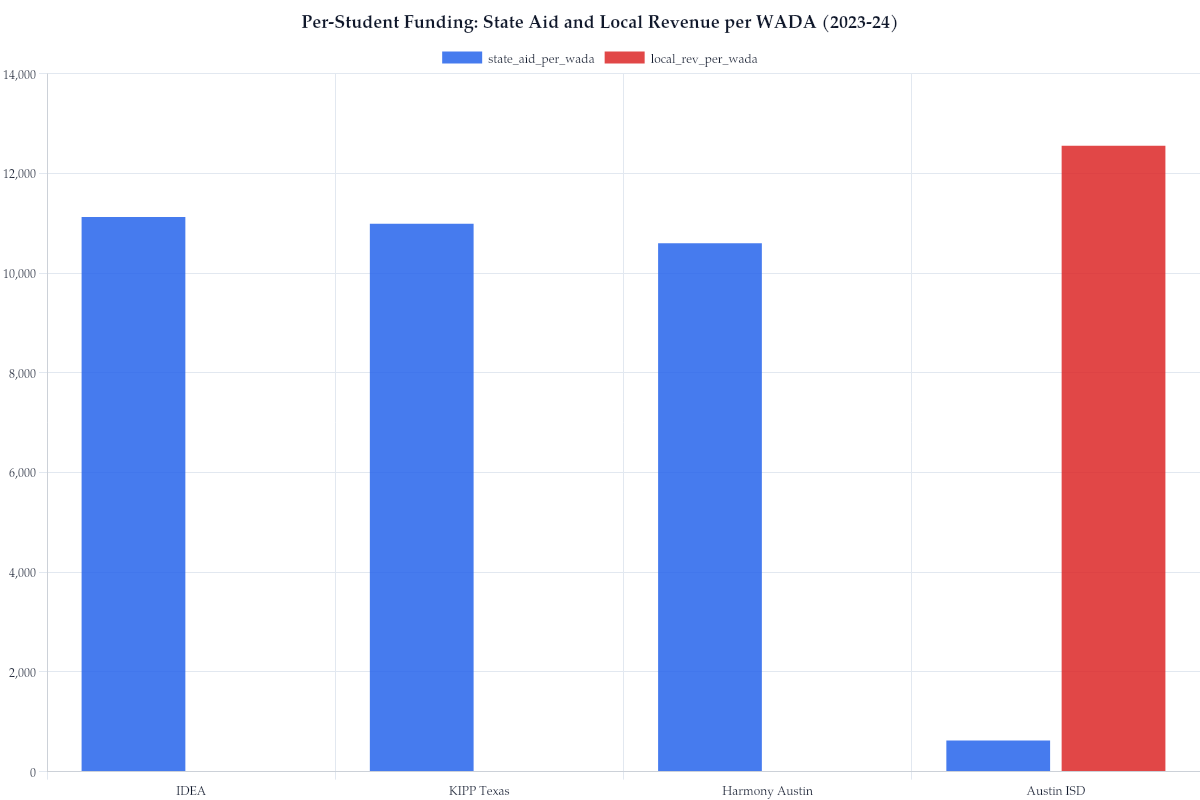
Austin ISD shares territory with three major charter networks including KIPP Texas (8 Austin campuses, approximately 4,320 students), Harmony Public Schools (7 campuses, 4,509 students), and IDEA Public Schools (8 campuses, approximately 5,000 students). Austin ISD enrolled ~ 72,800 students in 2023-24, declining from 75,400 in 2020-21 (Texas Education Agency, 2024). These three charter networks collectively served approximately 13,700 students in the same geographic area. These parallel systems operate under different governance structures, different facility funding mechanisms, and different accountability standards. Open-enrollment charters receive 100% of their funding from state per-pupil allotments under TEC Chapter 12. Austin ISD generated $913.1 million in local property tax revenue in 2023-24, returned $664.8 million to the state through recapture under TEC Chapter 49, and received $45.4 million in state aid. Austin ISD returned $664.8 million in recapture payments to the state in 2023-24 under TEC Chapter 49. In the November 2023 VATRE, voters approved a 6.67-cent M&O tax rate increase generating approximately $54 million in additional annual revenue, most of which flows back to the state through recapture.
Austin ISD declined from 75,400 students (2020-21) to 72,800 (2023-24). KIPP Austin declined 16.6% over the same period, from 5,445 to 4,997. IDEA Austin grew 22%, from 7,660 to 9,342. Harmony remained stable. The market-competition theory underlying charter expansion policy predicts that failing schools close and successful schools expand in a zero-sum transfer. Austin contradicts this prediction from both directions: KIPP contracted alongside the ISD, while IDEA expanded even as the ISD contracted. Both Austin ISD and KIPP face the same pressures of declining birth rates across Travis County, rising housing costs displacing families from the urban core, and a kindergarten capture rate of approximately 45% (Austin ISD, 2024). At the same time, IDEA opened six new Austin campuses between 2020 and 2024, each generating its own state per-pupil allotment. New facility construction created enrollment demand where it did not previously exist; a pattern seen in other regions as well.
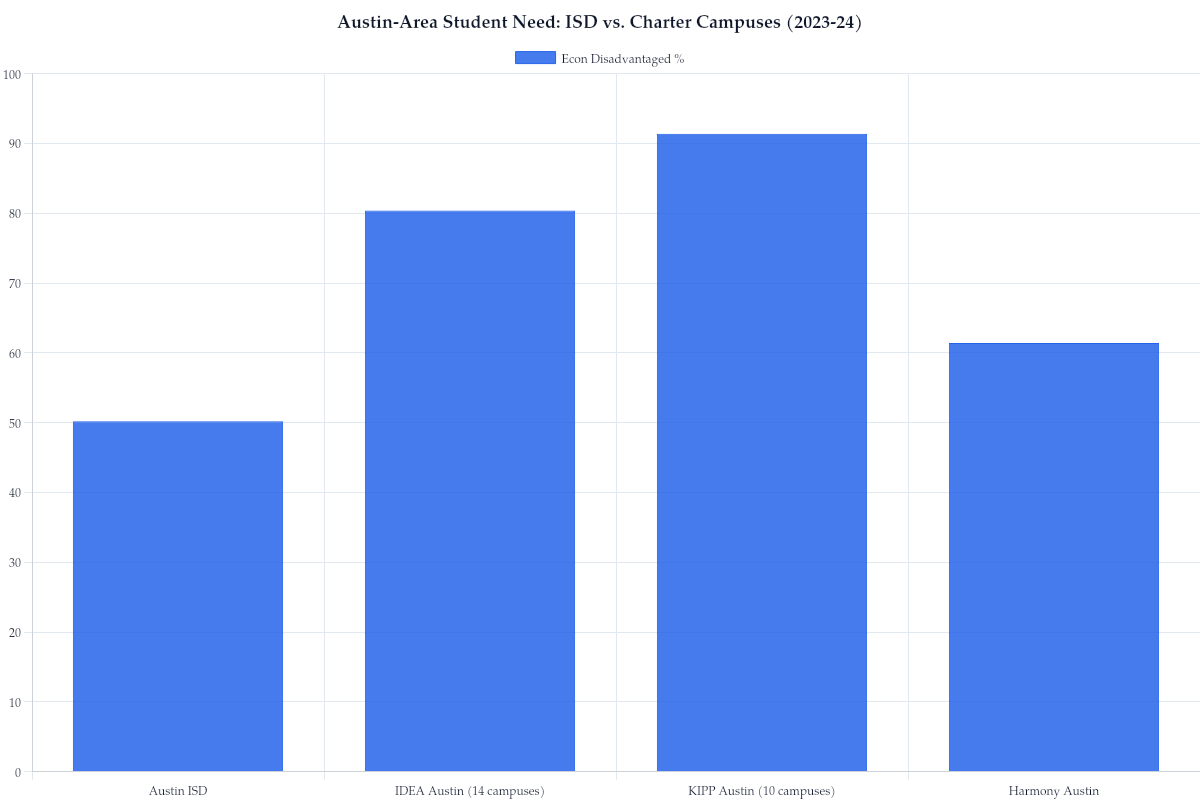
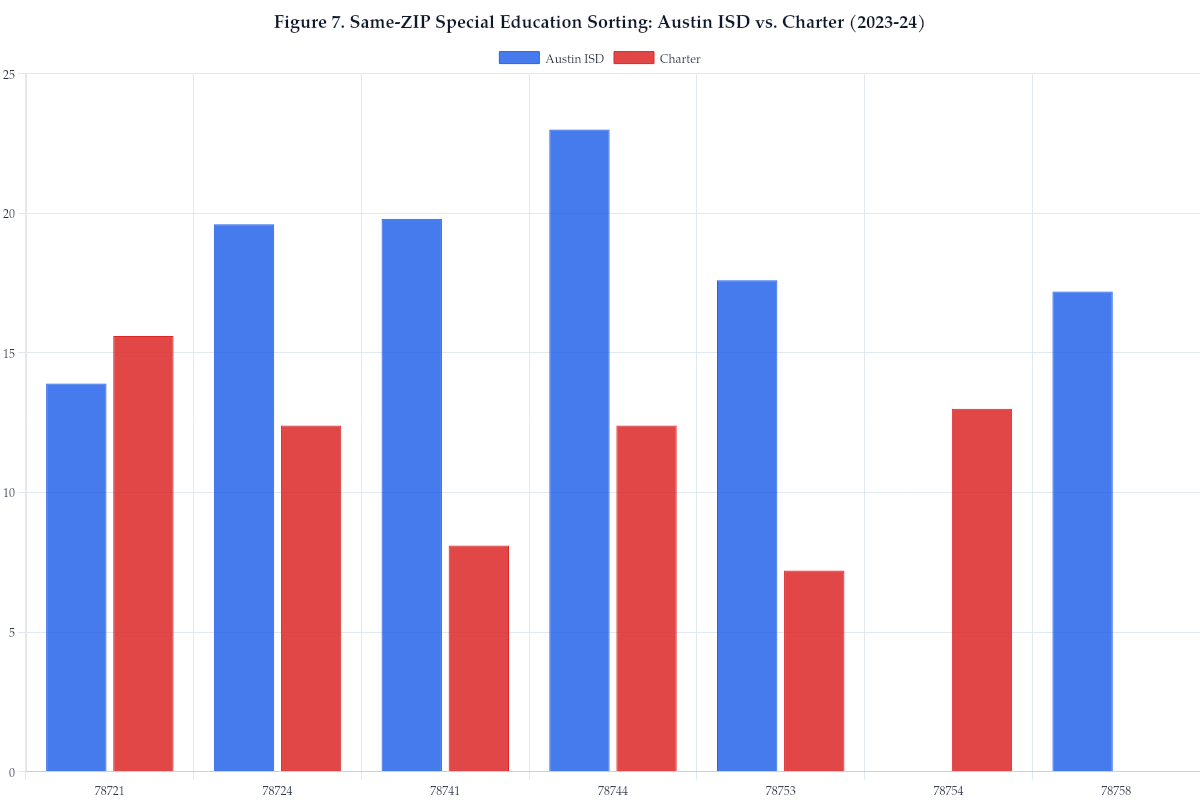
Seven ZIP codes in the Austin area contain both Austin ISD campuses and charter campuses from either KIPP, IDEA, or Harmony. A same-ZIP-code comparison using NCES Common Core of Data coordinates (2023-24) shows that at-risk and economically disadvantaged rates are nearly identical between sectors (at-risk ISD 74.0%, charter 74.6%; economically disadvantaged ISD 85.2%, charter 89.2%, Texas Education Agency, 2024; NCES CCD, 2023-24). The forces of selection move through special education. Austin ISD campuses in shared ZIP codes serve 19.2% special education students compared to 11.6% at charter campuses. ZIP code 78744, the densest overlap zone with nine campuses from each sector, demonstrates this clearly. In this area, Austin ISD campuses serve 23.0% special education students while charter campuses serve 12.4%. In ZIP code 78753, ISD campuses average 17.6% for special education, while IDEA Rundberg and Harmony Science Academy Austin serve populations with an average special education rate of 7.2%. Fuller (2014) documented that within the same neighborhoods, charter entrants carry lower service costs than students who remain in the ISD. The Austin area data confirms this.
Bifulco and Reback (2014) documented that when charter schools draw disproportionately from the non-special-education population, fixed costs concentrate in the ISD. The per-pupil cost of service rises even as enrollment revenue declines. The same-ZIP-code data confirms that the selective forces in Austin operate through special education enrollment rather than through income or at-risk status, where charter and ISD campuses serve statistically similar populations.
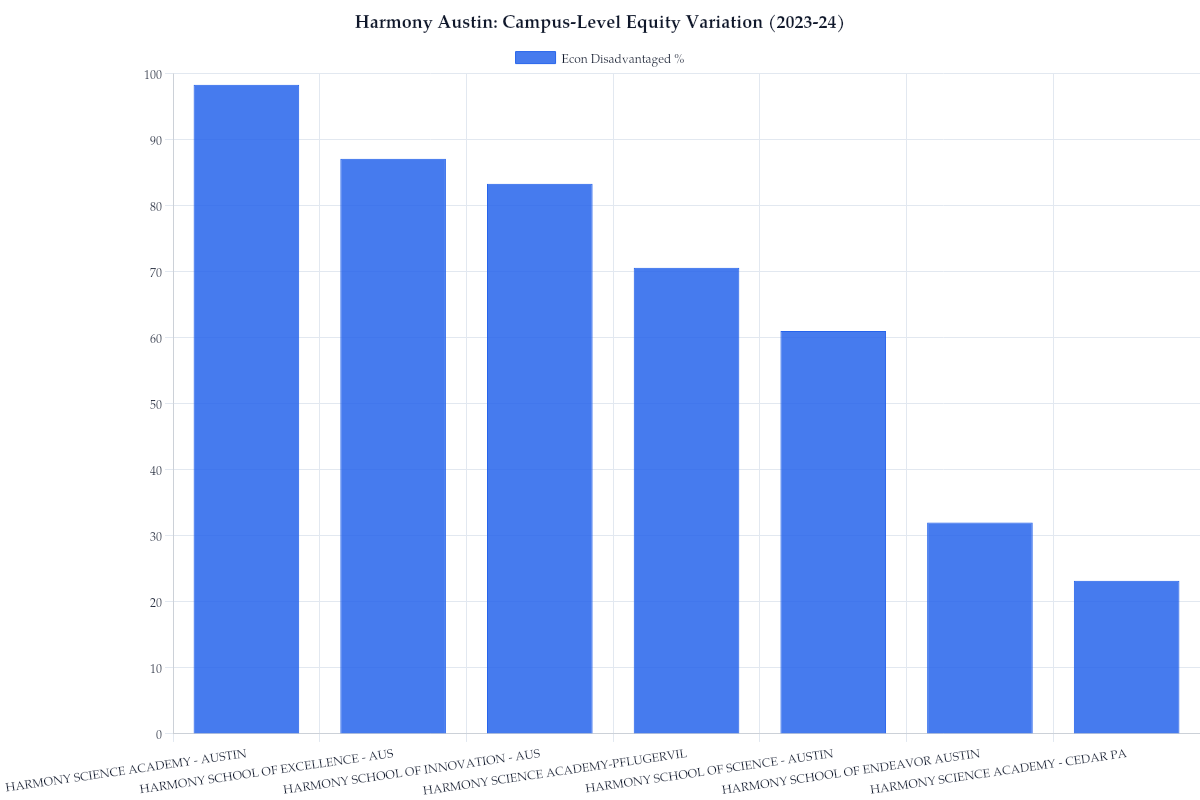
Harmony Austin's seven campuses show the widest demographic spread of any network in the area. Harmony Science Academy Cedar Park serves 18.5% economically disadvantaged students, drawing from the affluent Cedar Park-Leander corridor. Harmony Science Academy Austin serves 96.9%, drawing from the Rundberg-Lamar corridor. The constitutional standard requires 'substantially equal access to similar revenue per pupil at similar levels of tax effort' (Edgewood I, 777 S.W.2d at 397). Charter schools bypass the tax effort component entirely. Their funding comes exclusively from the state, with no local contribution. Austin-area charter networks collectively reflect demographics similar to Austin ISD, but only Austin ISD is subject to $664.8 million in annual recapture payments. ISDs are geographically bound with student demographics that reflect their community. Charter networks, on the other hand, choose where to open campuses. A single publicly funded charter network maintaining campuses ranging from 18.5% to 96.9% economically disadvantaged within the same metropolitan area, while contributing nothing to the local tax base, raises the question of whether the system provides substantially equal access when different populations within the same funding system receive different levels of service.
On November 21, 2025, the Austin ISD Board of Trustees voted to close 10 schools effective at the end of the 2025-26 school year: Martin MS, Bedichek MS, Dawson ES, Odom ES, Oak Springs ES, Palm ES, Barrington ES, Widen ES, Winn Montessori ES, and Sunset Valley ES. The closures save $21.5 million annually, displace 3,796 students, and eliminate 6,319 empty seats (Austin ISD Board Minutes, November 21, 2025). Four closures overlap with campuses operating in charter-proximity zones identified in Austin ISD PIR #8: Odom, Widen, Bedichek, and Martin. Martin MS and Bedichek MS both served student populations with at-risk rates above 60%. One month later, KIPP Texas closed five Austin campuses: Brave HS, Beacon Prep MS, Obras Primary, Academy of Arts and Letters MS, and Alegria Primary. Both systems contracted simultaneously while Austin ISD carries $3.49 billion in outstanding bond debt. When the district closes a school, the bond obligations remain. Taxpayers continue servicing debt on empty buildings under TEC Chapter 45 restrictions. KIPP closed its five campuses with no residual fiscal obligation to Austin-area taxpayers. IDEA continued operating 14 campuses. Harmony maintained 7. State funding to charter competitors did not decrease by a single dollar.
Austin ISD's Mendez Middle School received an F accountability rating from TEA beginning in 2013. After a decade of F ratings, Austin ISD partnered with Third Future Schools (TFS) through an SB 1882 agreement in March 2022. TFS received management authority and an $888 per-student funding premium over traditional Austin ISD campuses. By 2023, Mendez improved to a B accountability rating, but enrollment had collapsed to 203 students in a 1,229-seat building. During this time, TFS transferred $49 million in Texas public education revenue to fund Colorado operations during the partnership (Shipp, 2024; Lee, 2024). Austin ISD will resume direct management in the 2026-27 school year. The Mendez example connects to the policy pipeline documented in Section 4B, where Miles created TEI at Dallas ISD, founded TFS, managed Mendez through SB 1882, and was then appointed HISD superintendent by Morath. Across the full SB 1882 program statewide, 18 of 30 concluded K-12 partnerships ended with failing accountability ratings, a 60% failure rate by the state's own standards.
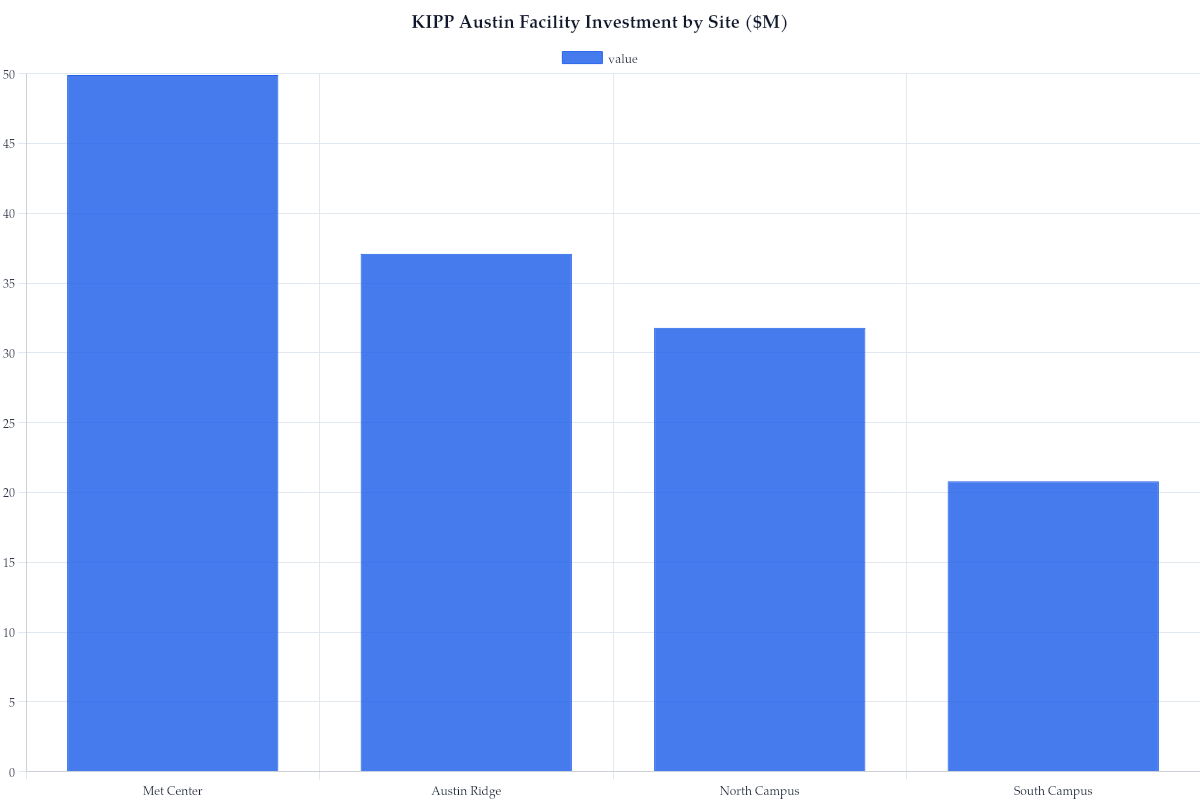
KIPP Texas invested $139.6 million across four Austin facility sites with zero revenue bonds and zero voter approval, adding 9,244 seats (KIPP Texas, PIR #9 Response, 2026). Austin ISD required 72% voter approval for its $1.05 billion 2017 bond package. KIPP required zero votes for $139.6 million.
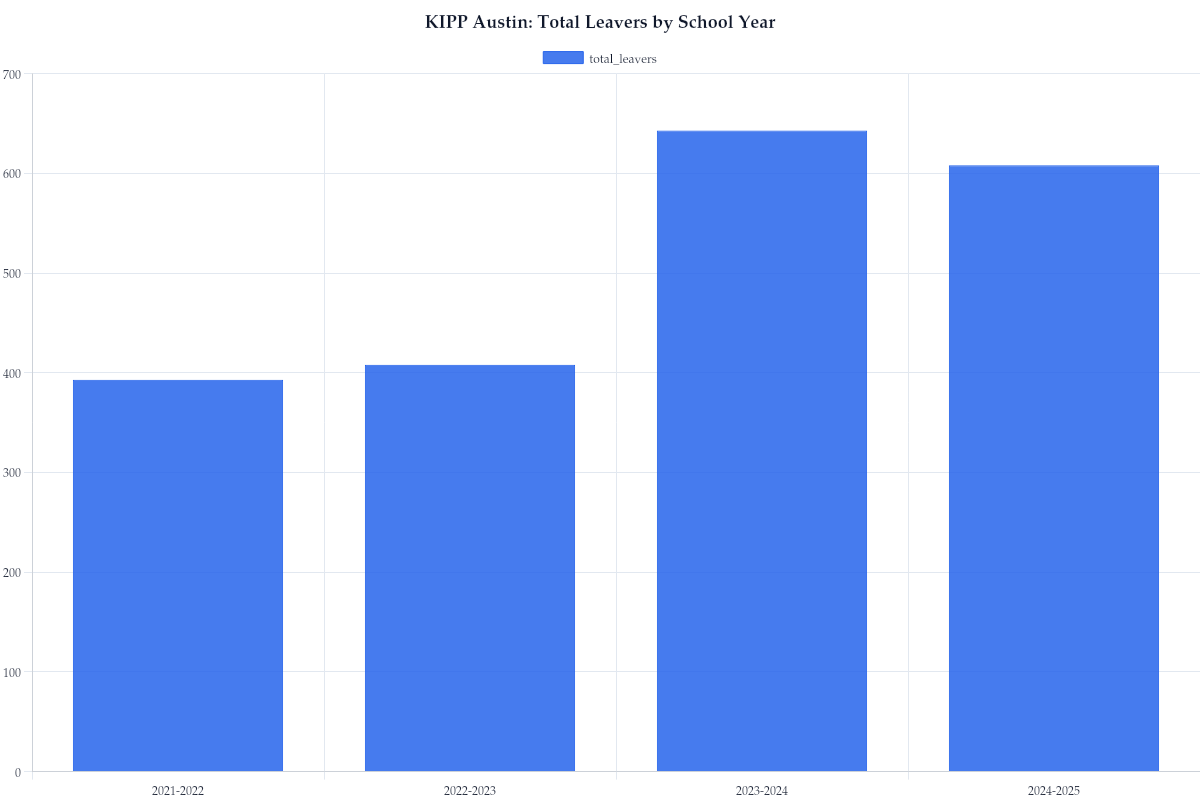
KIPP Austin campuses reported 2,052 leavers across 15 campuses over four school years, 2021-22 through 2024-25 (KIPP Texas, PIR #9 Response, 2026). KIPP Austin Brave (high school) lost 52 students in 2024-25 across grades 9-12. KIPP Paseo Primary lost 14 students from grade 1 and 13 from grade 2 in 2024-25. TEA categorizes leavers as transfers, dropouts, and other departures. Full withdrawal data, which would distinguish voluntary exits from involuntary separations, was requested but not yet provided.
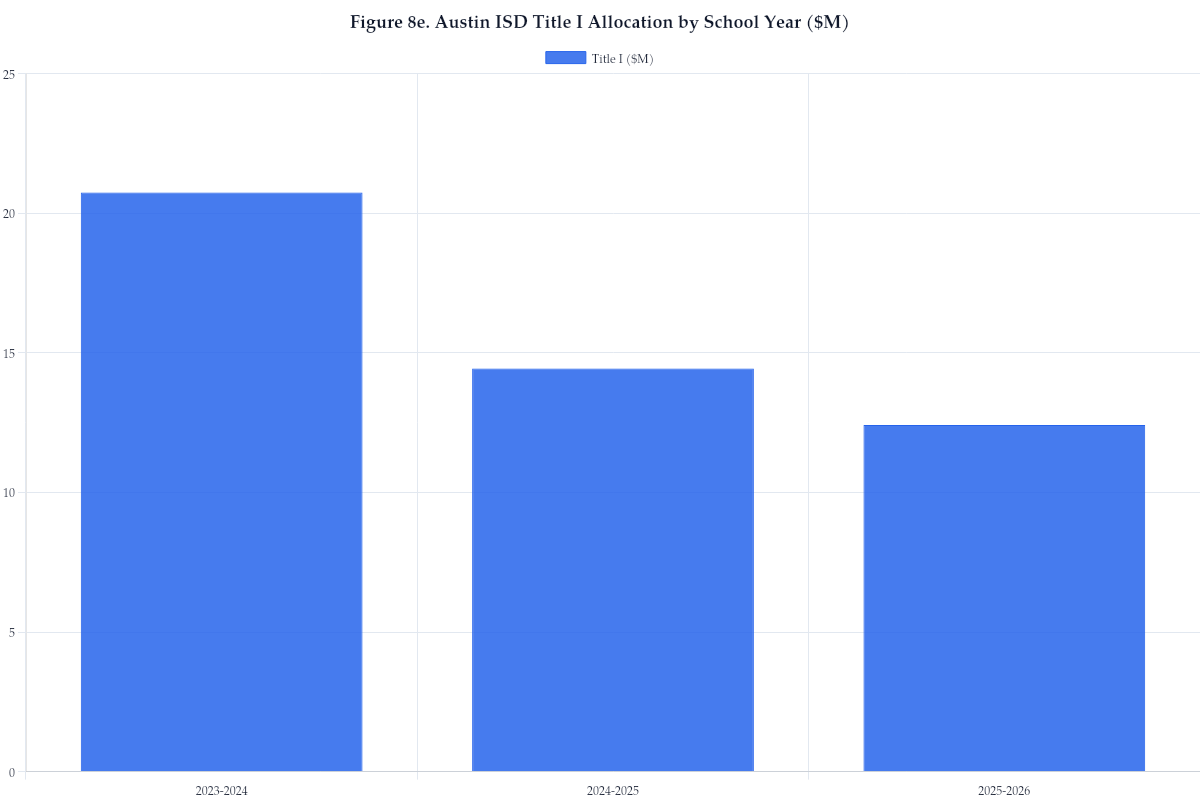
Students who exit charter campuses return to the ISD, carrying service costs the charter avoided back to the ISD. The leaver data obtained through a public information request reveals that KIPP's five closed Austin campuses (Brave, Beacon Prep, Obras, Arts and Letters, Alegria) collectively reported 627 leavers in 2023-24, the year before closure was announced (KIPP Texas Public Schools, 2026). At the same time, Austin ISD's Federal Title I allocations declined 40% from $20.7 million (2023-24) to $12.4 million (2025-26) as enrollment losses reduced federal formula entitlements (Austin ISD, 2025). Six Austin ISD campuses lost Title I funding entirely during this time.
The dual operation of charters and ISD in Austin creates structural inefficiency through duplicated governance, stranded costs, demographic sorting through special education enrollment differences, and simultaneous contraction. Under the Morath suitability standard requiring structural soundness, a system that produces two collapsing school networks in the same geography fails the efficiency test. In the current system, Austin ISD returns $664.8 million in recapture payments to the state while competing against charter networks receiving $1.28 billion in state aid collectively. The Edgewood I court (1989) held that the state must provide "substantially equal access to similar revenue per pupil at similar levels of tax effort" (777 S.W.2d at 397). A system in which the ISD absorbs all downside risk of contraction while charter operators retain all exit flexibility falls below the constitutional floor the Edgewood decisions established.
Student Need Comparison (2023-24)
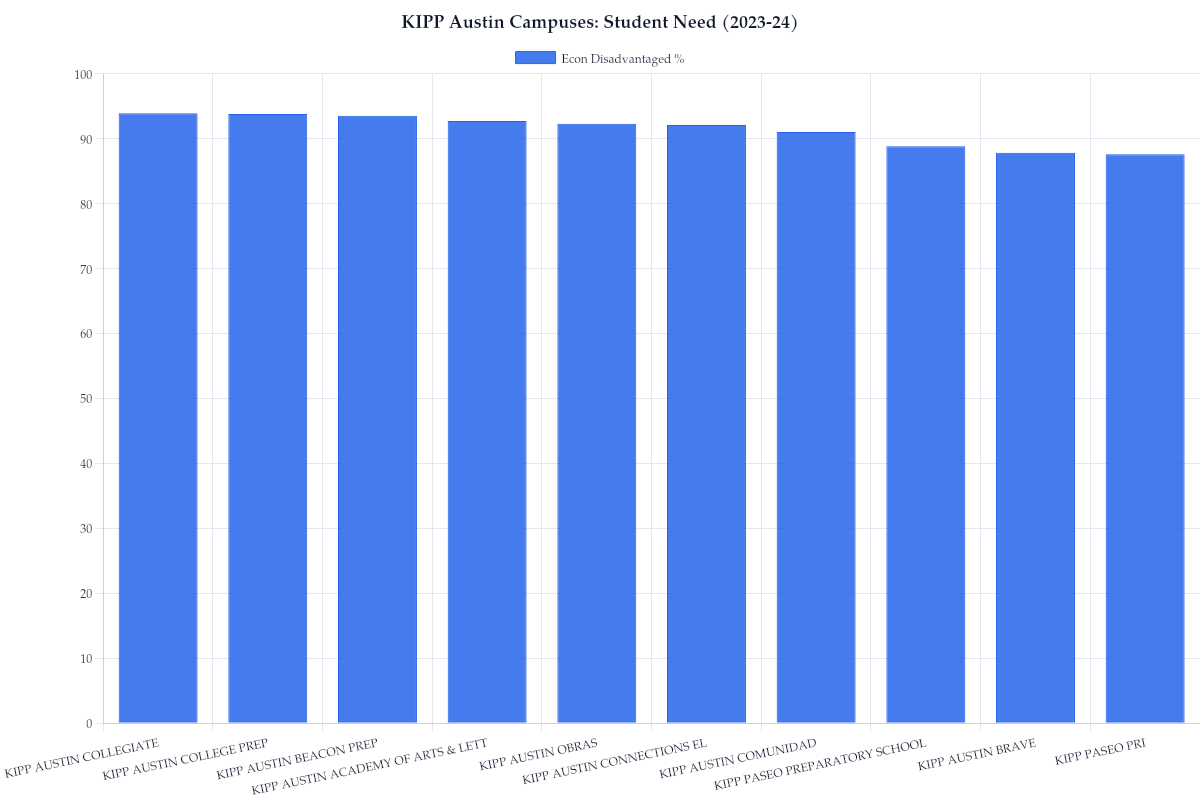
KIPP Austin Campuses: Student Need (2023-24)
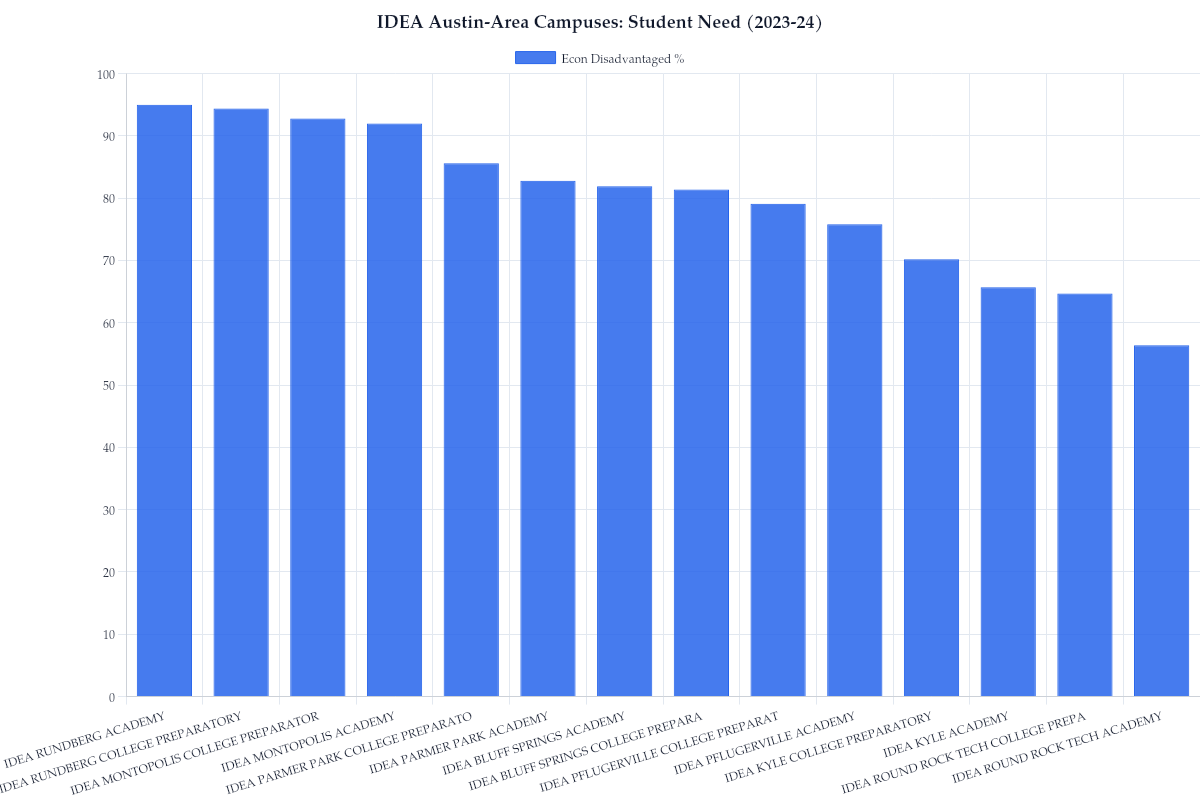
IDEA Austin-Area Campuses: Student Need (2023-24)
Austin-Area Student Need: ISD vs. Charter Campuses (2023-24)
Austin-Area Enrollment Trends (2020-2025)
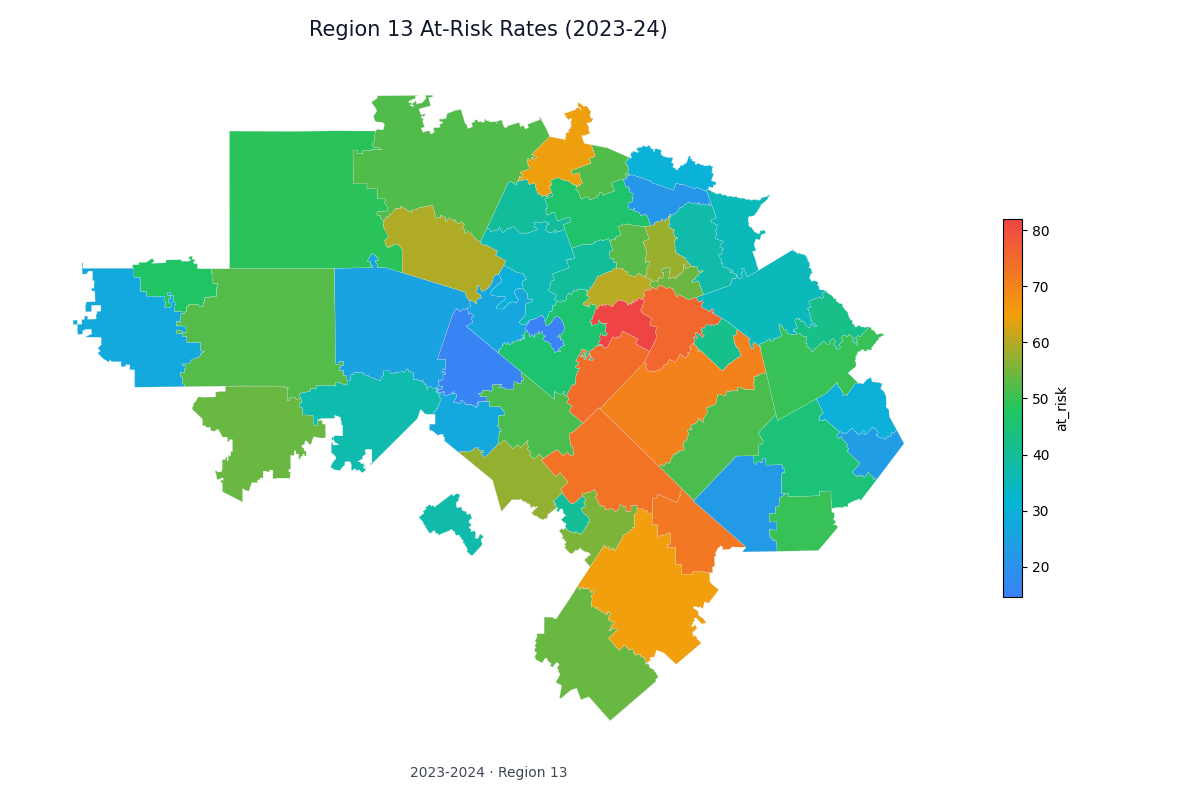
Region 13 At-Risk Rates (2023-24)
Harmony Austin: Campus-Level Equity Variation (2023-24)
Austin Metro: Campus Distribution by Student Need Tier (2024-25)
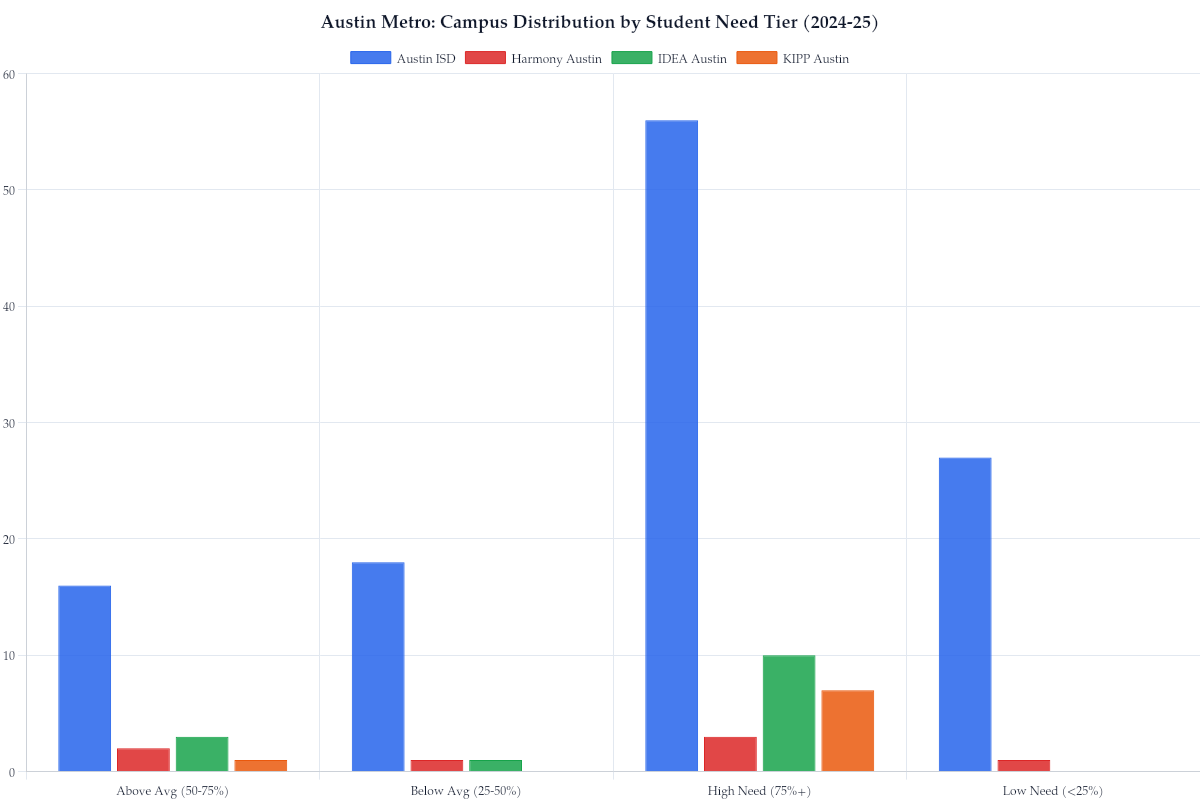
Figure 7. Same-ZIP Special Education Sorting: Austin ISD vs. Charter (2023-24)
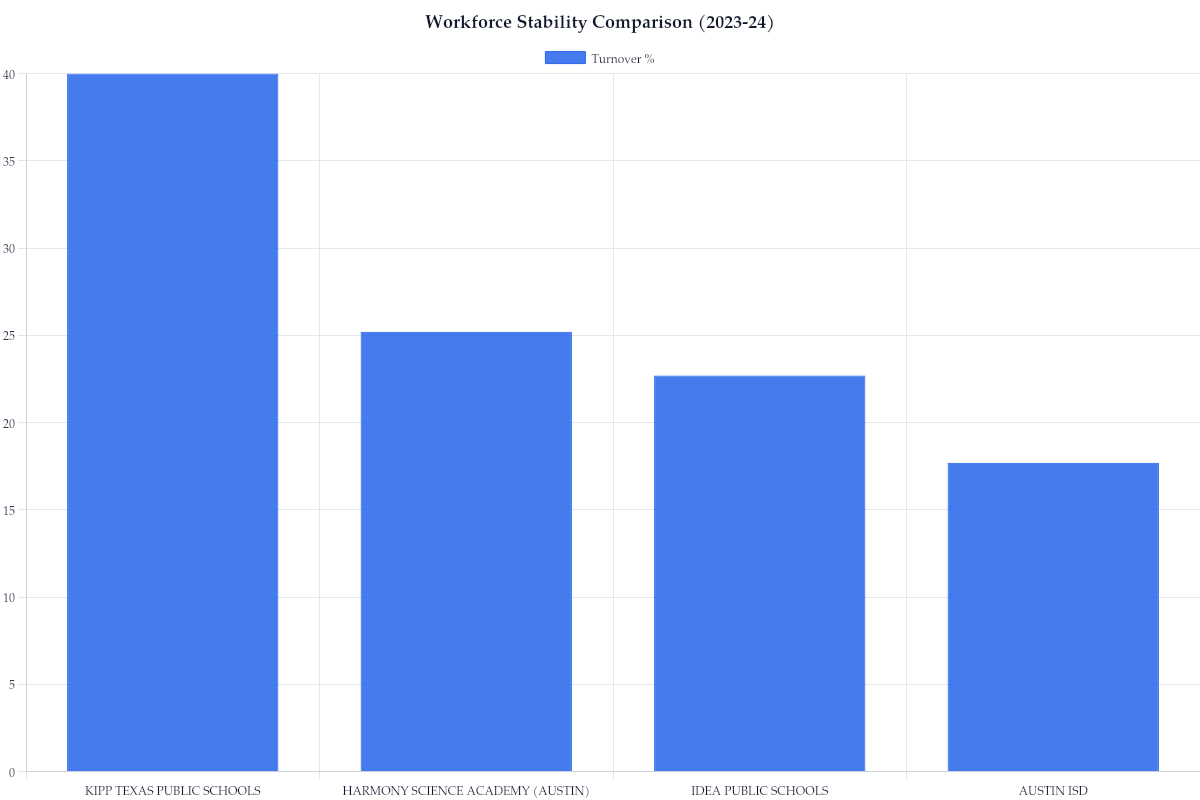
Workforce Stability Comparison (2023-24)
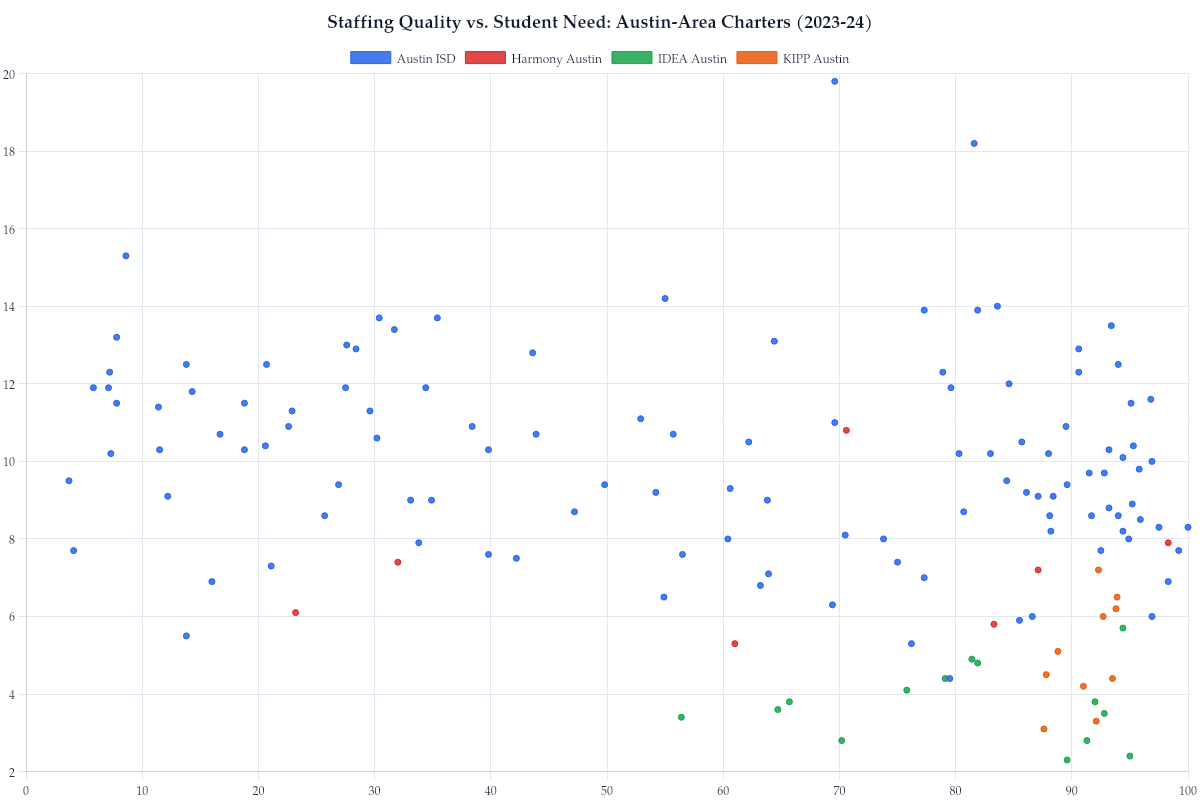
Staffing Quality vs. Student Need: Austin-Area Charters (2023-24)
Funding Structure: State Aid vs. Local Revenue (2023-24)
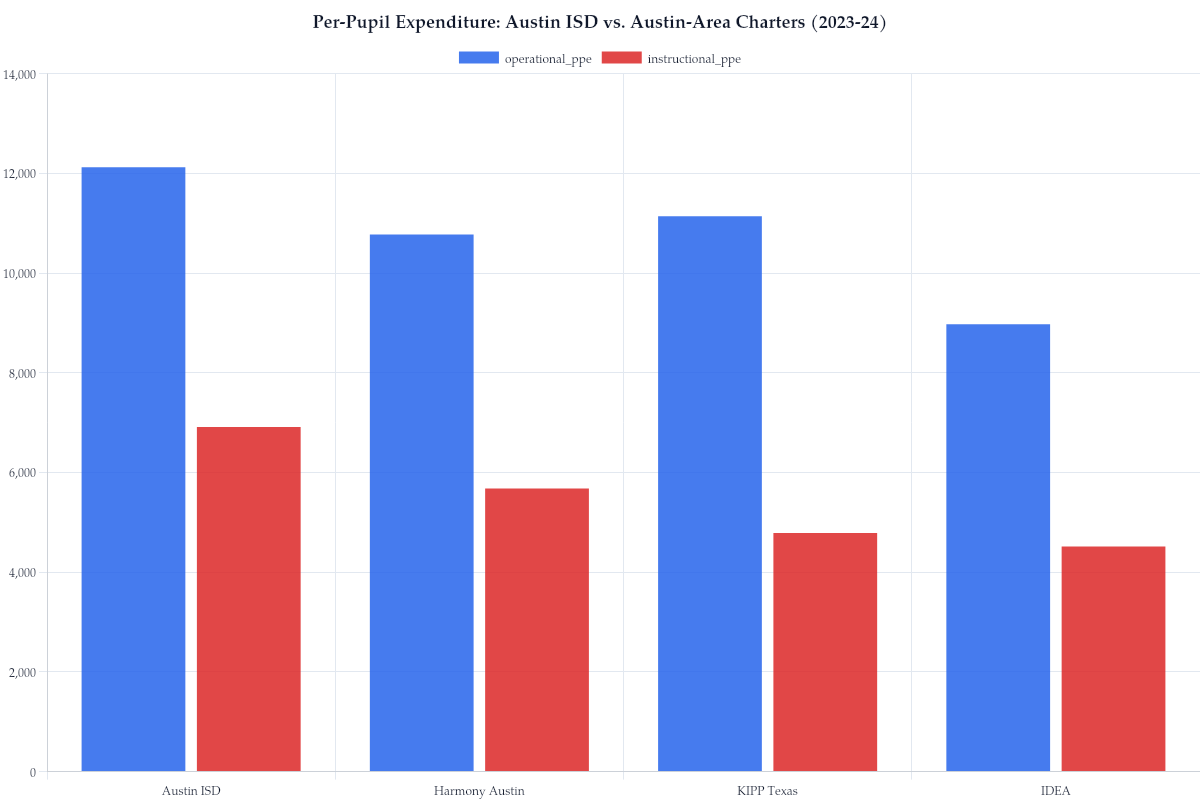
Per-Pupil Expenditure: Austin ISD vs. Austin-Area Charters (2023-24)
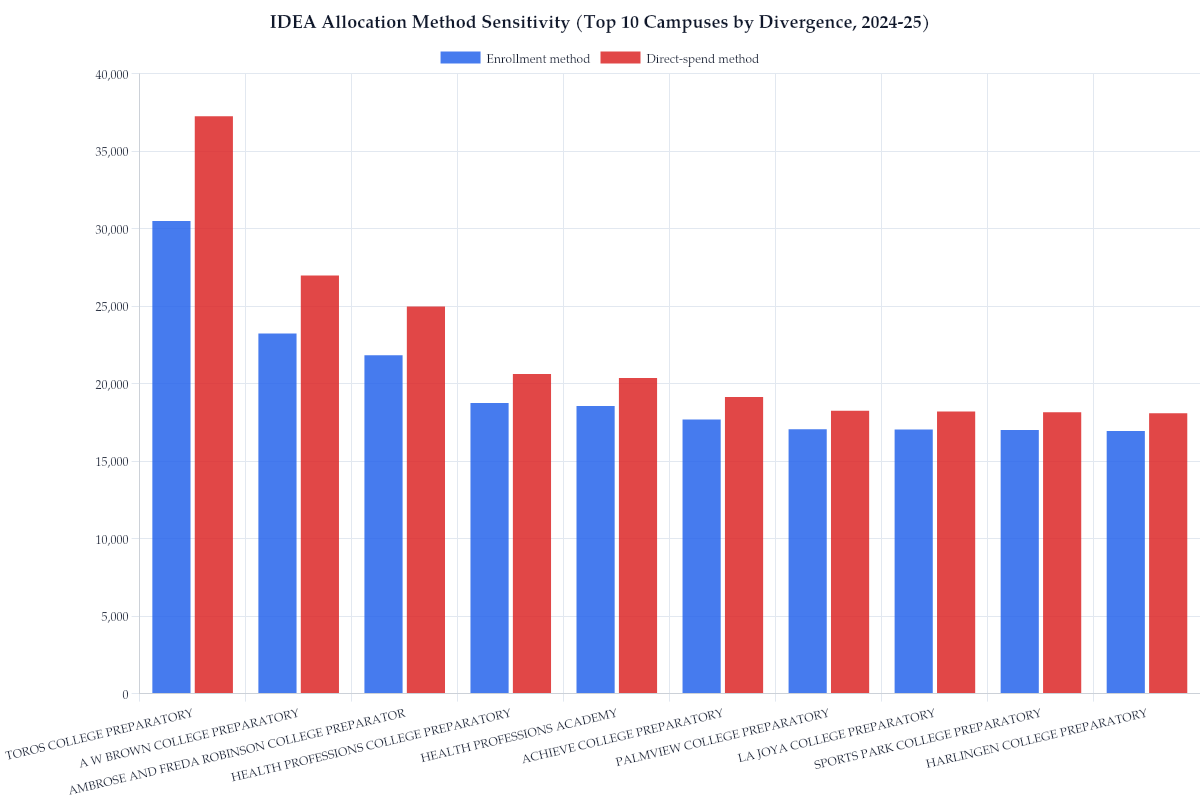
IDEA Allocation Method Sensitivity (Top 10 Campuses by Divergence, 2024-25)
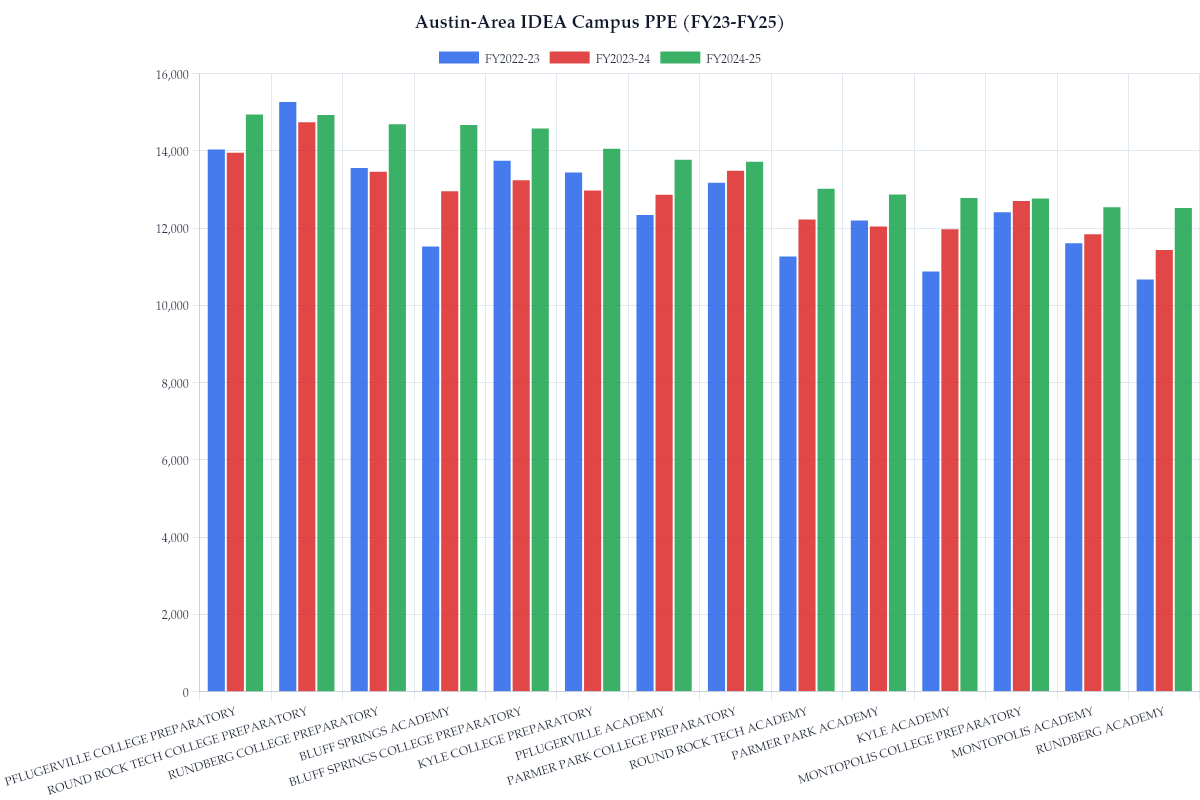
Austin-Area IDEA Campus PPE (FY23-FY25)
Per-Student Funding: State Aid and Local Revenue per WADA (2023-24)
KIPP Austin Facility Investment by Site ($M)
KIPP Austin: Total Leavers by School Year
Austin ISD: State Facility Subsidy (EDA Payments, FY2020-2025)
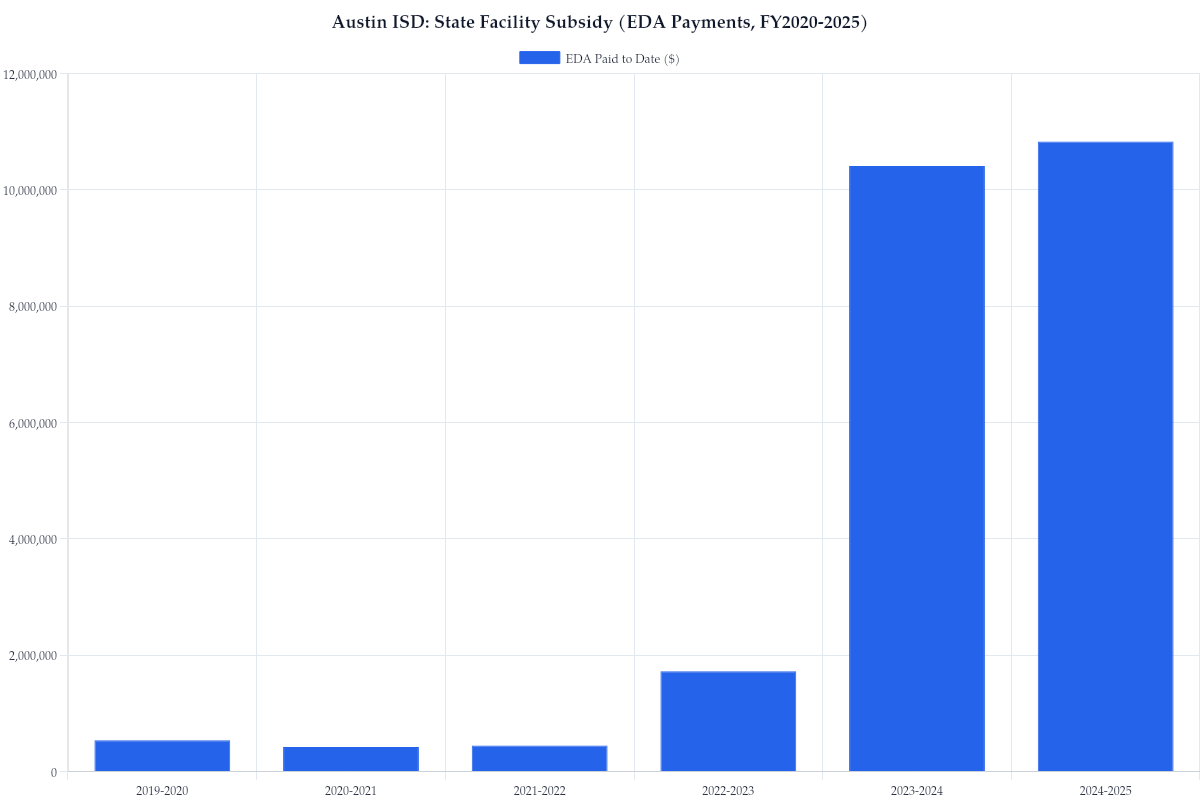
Figure 8e. Austin ISD Title I Allocation by School Year ($M)