Chapter 4D: Cleveland ISD and the Bond Election Mechanism
Chapter 4D: Cleveland ISD and the Bond Election Mechanism
A three-lens analysis of how the Texas bond election mechanism fails high-need communities. Micro lens: Cleveland ISD vs. 4 fast-growth comparators. Charter lens: state-directed ILTexas expansion instead of help. Macro lens: statewide pattern of 738 failures, athletics filter, and charter presence in repeat-failure districts.
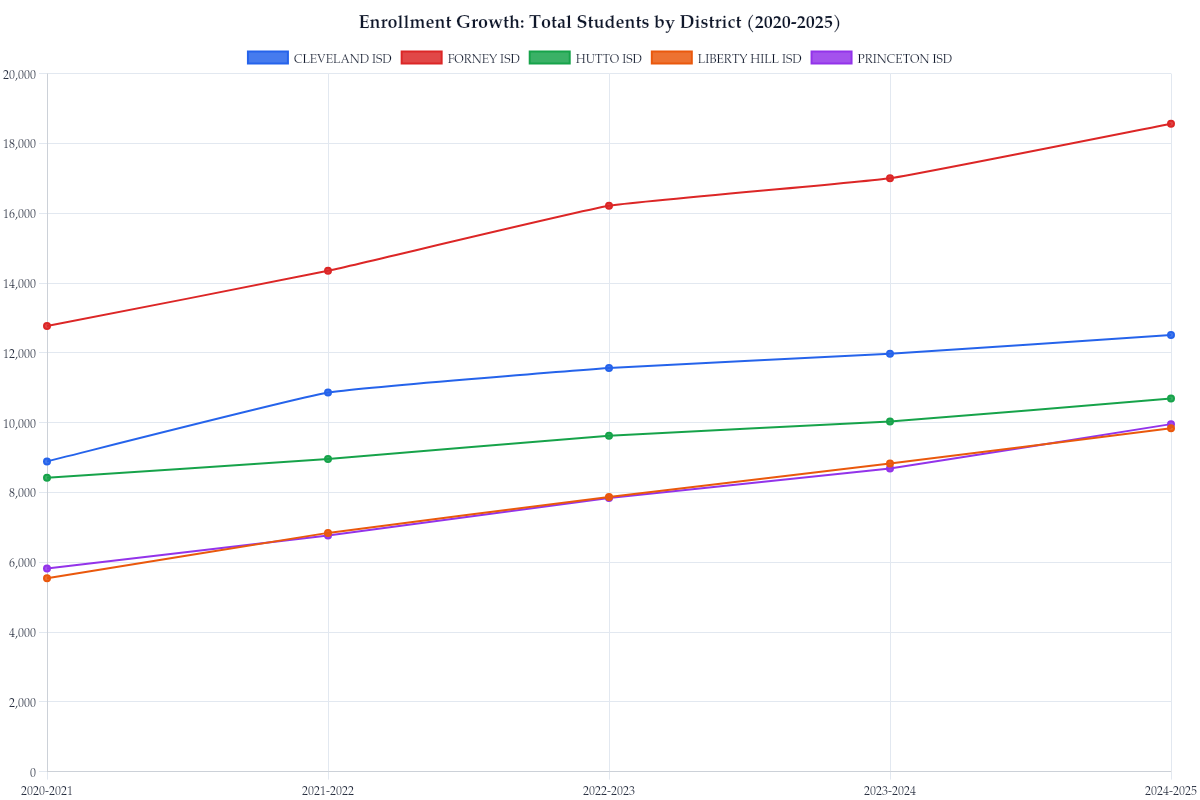
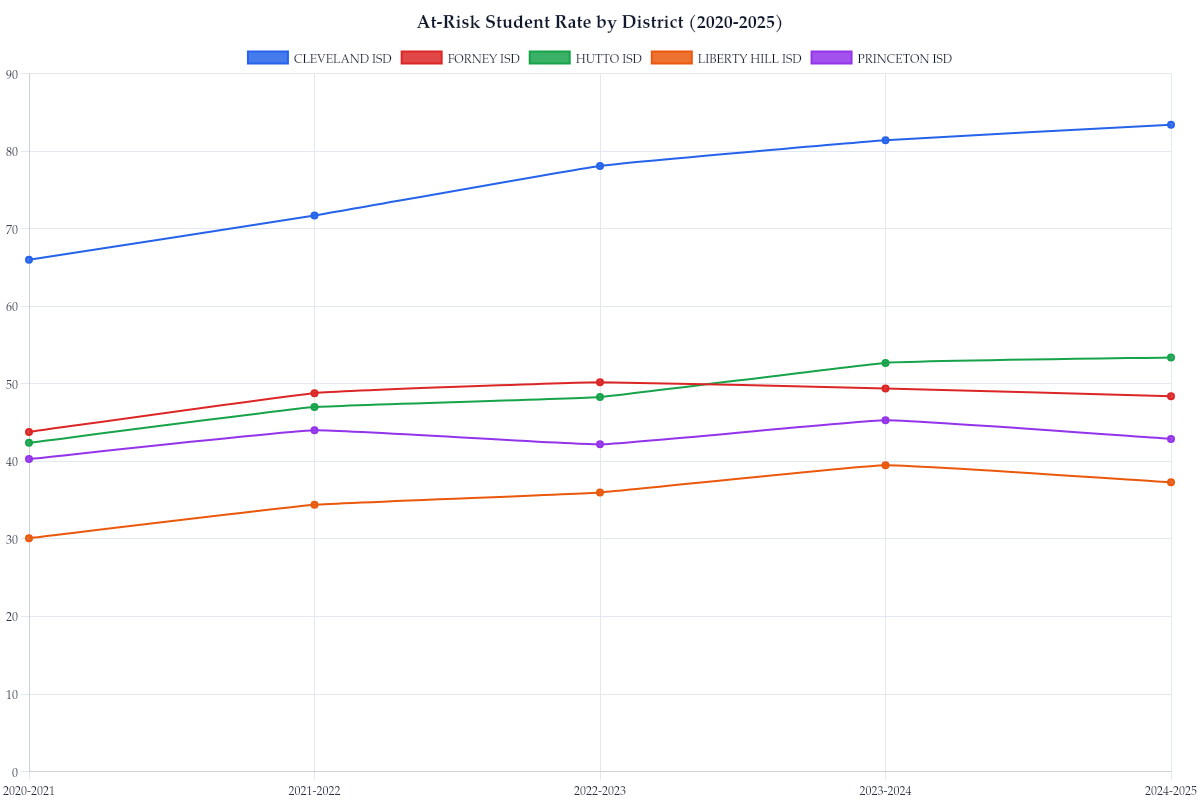
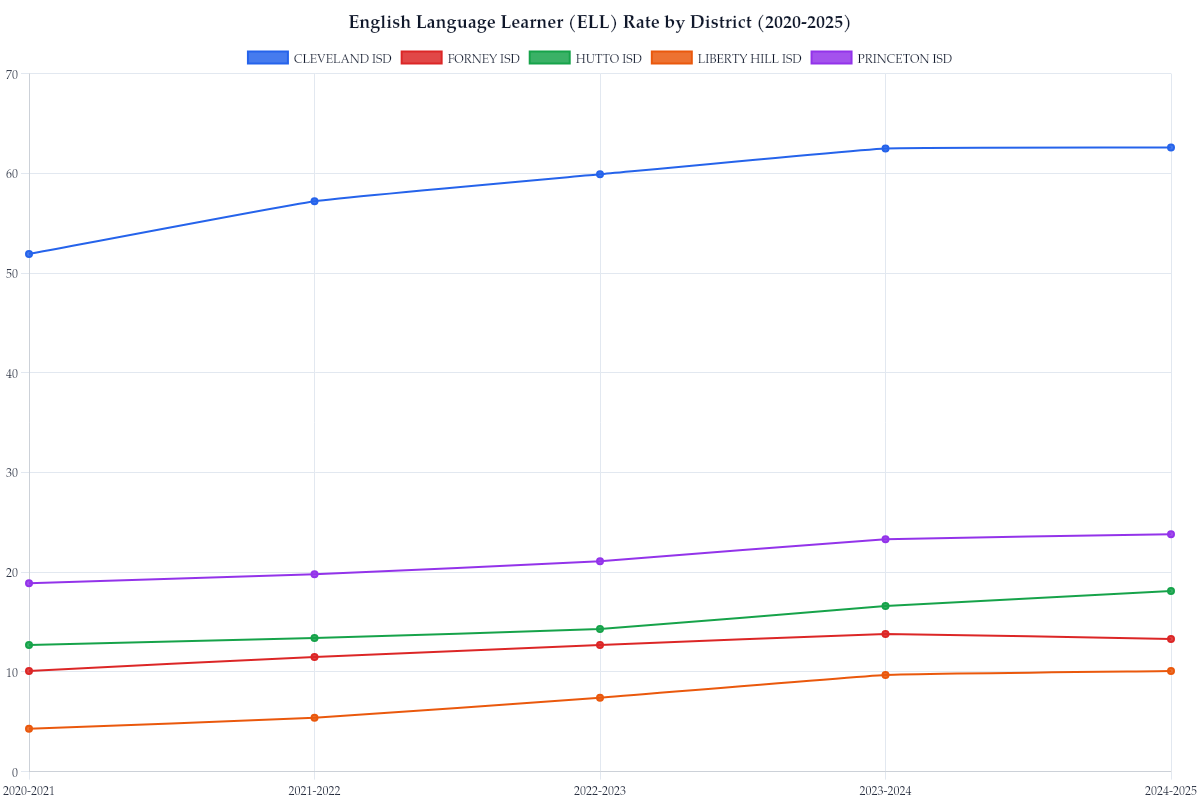
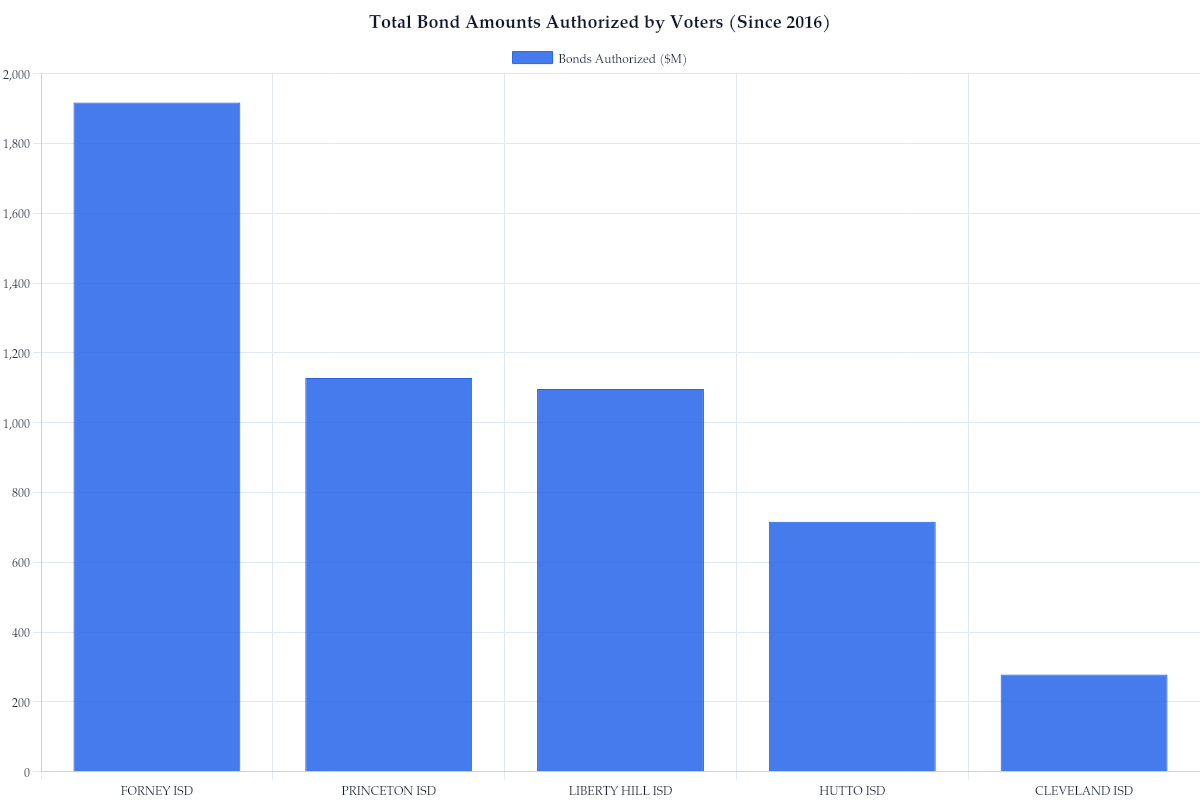
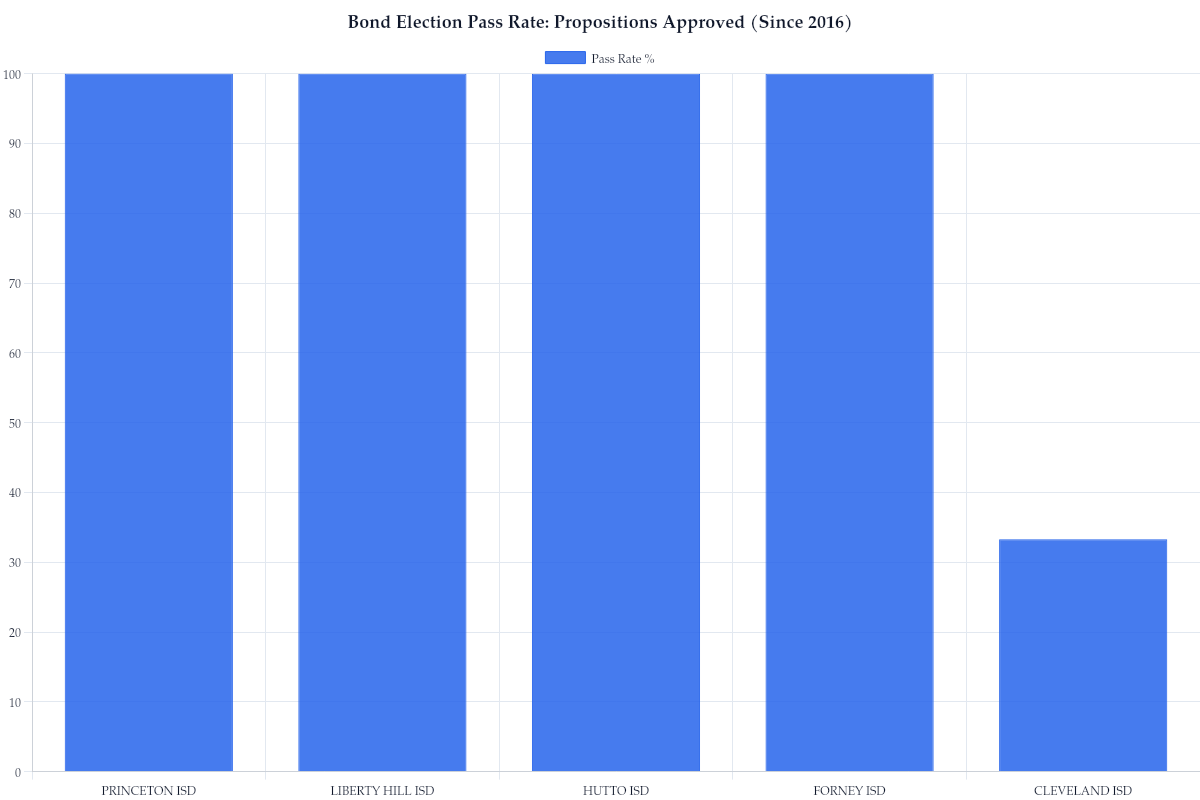
Cleveland ISD has failed 4 of 5 bond elections since 2019, securing only $198 million of the $838 million it placed before voters. Forney ISD, Princeton ISD, Liberty Hill ISD, and Hutto ISD are four comparable fast-growth districts that passed 15 of 15 non-athletic bond propositions across 8 elections in the same 2019-2023 period (Texas Bond Review Board, 2024). All five districts experienced enrollment growth exceeding 40% since 2014, operating under the same state funding formulas and bond election statutes. The critical difference is that Cleveland ISD serves 92.8% economically disadvantaged students with 62.6% English Language Learners, while the comparators range from 30% to 65% economically disadvantaged with ELL rates below 20% (Texas Education Agency, 2024).
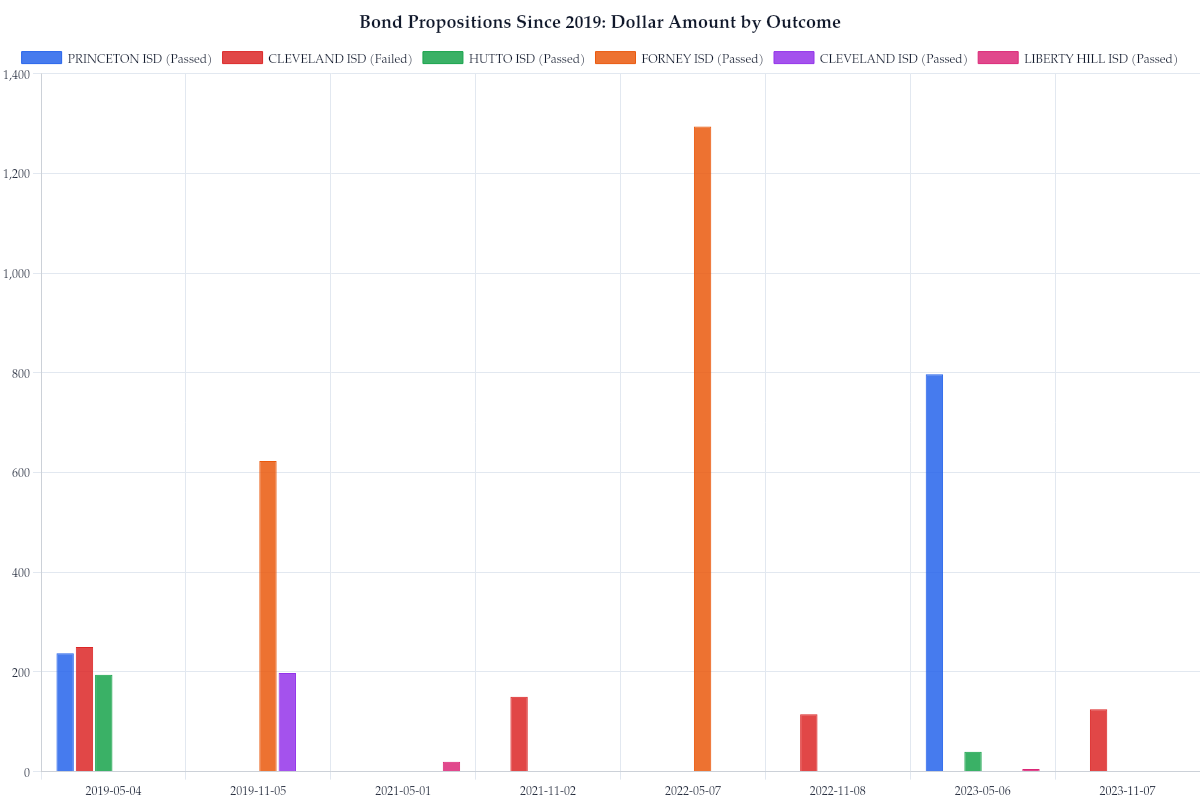
Cleveland ISD's enrollment doubled from 3,300 students in 2013 to 12,513 in 2024-25, with a projection of reaching 23,558 by 2034-35 (Cleveland ISD, PIR #3, 2024). The district utilizes 186 portable buildings, which are more costly to the district over time compared to permanent structures. Cleveland ISD's property tax base grew from $850 million to $3.8 billion between 2015 and 2024, yet voters have consistently rejected facility bonds. Forney ISD passed 2 of 2 bond elections totaling $1.917 billion (a $623 million bond in November 2019 and a $1.294 billion bond in May 2022). Princeton ISD passed 2 of 2 bond elections in the same window (May 2019 $237.4 million and May 2023 $797 million) totaling $1.034 billion with strong voter support. Liberty Hill ISD passed 7 of 7 propositions across 2 bond elections (May 2021 and May 2023) totaling $962.8 million, including a $20 million stadium. Hutto ISD passed 4 of 4 propositions across 2 bond elections (May 2019 $194.4 million and May 2023 $522 million across 3 propositions) totaling $716.4 million (PIR responses #12-15, 2024).
The Colony Ridge Effect
The development of Colony Ridge in Cleveland, Texas became a national political flashpoint in 2023. Governor Greg Abbott and Attorney General Ken Paxton targeted the development with allegations of harboring undocumented immigrants. In February 2026, the Department of Justice (DOJ) and the Consumer Financial Protection Bureau announced a $68 million settlement with Colony Ridge developers for exploiting Latino borrowers with predatory lending practices (CFPB, 2026). The settlement included $48 million for infrastructure improvements and $20 million for law enforcement, plus a 3-year construction halt.
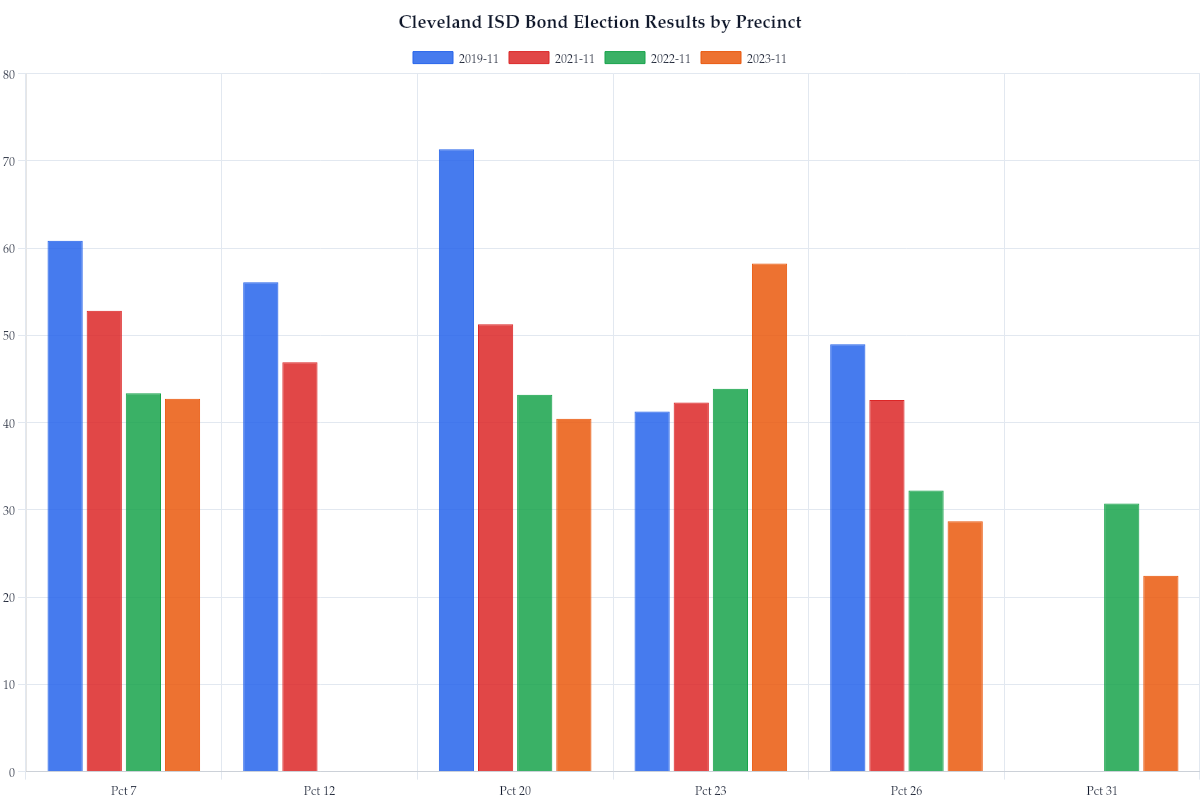
Precinct-level canvass data from Cleveland ISD's four bond elections reveal the geographic concentration of opposition. Precinct 26, which includes Colony Ridge-adjacent areas, dropped from 49% FOR in 2019 to 28.7% FOR in 2023. Precinct 31, another Colony Ridge-area precinct, voted 22.4% FOR in 2023, the lowest support of any Cleveland ISD precinct (Liberty County Elections Office, 2023). The 2023 proposition was $125 million, half the size of the 2019 proposition that failed at $250 million.
It is not within the scope of this study to determine the motivations behind the precinct-level opposition pattern to the bond proposals. General anti-tax sentiment, ISD governance distrust, reaction to rapid residential growth, and the politicized environment surrounding the development are all plausible explanations for the failure. Regardless, the structural consequence remains the same. When Colony Ridge-area precincts vote 70-77% AGAINST, they pull the district-wide margin below the 50% threshold required for passage (Liberty County Elections Office, 2023).
The Facilities Funding Mechanism
Texas provides two parallel systems for school facility funding. ISDs issue general obligation (GO) bonds backed by property taxes, requiring voter approval. Charter schools issue revenue bonds backed by Foundation School Program operating revenue through the Charter School Finance Corporation (TEC Ch. 53), requiring no voter approval.
The Instructional Facilities Allotment (IFA, TEC Ch. 46A) is a guaranteed yield program: the state fills the gap between a district's local revenue and $35 per ADA per penny of tax effort. IFA requires a passed bond election as a prerequisite. When voters reject bonds, the district loses access to both the bonds and the state equalization mechanism simultaneously. Charter schools are excluded from IFA by statute. The IFA guaranteed yield has been frozen at $35/ADA/penny since 1999. Statewide IFA appropriations fell 67% over 11 years, from $633 million to $208 million (Texas AFT, 2024). Cleveland ISD's IFA per student dropped 77%, from $503 to $117, between FY20 and FY24 while enrollment grew 58% (TEA, PIR #2502721, 2024).
The Existing Debt Allotment (EDA, TEC Ch. 46B) provides a guaranteed yield of $40/ADA/penny, raised from $35 in 2017 and frozen since. Charter schools receive partial EDA access to these yields. The state pays the full EDA entitlement because charters have no property tax revenue. The New Instructional Facility Allotment (NIFA) assists with equipping new campuses, but charter schools are excluded. The Charter Facilities Allotment was capped at approximately $73/student until HB 2 (89th Legislature, 2025) raised it to $372.90/ADA.
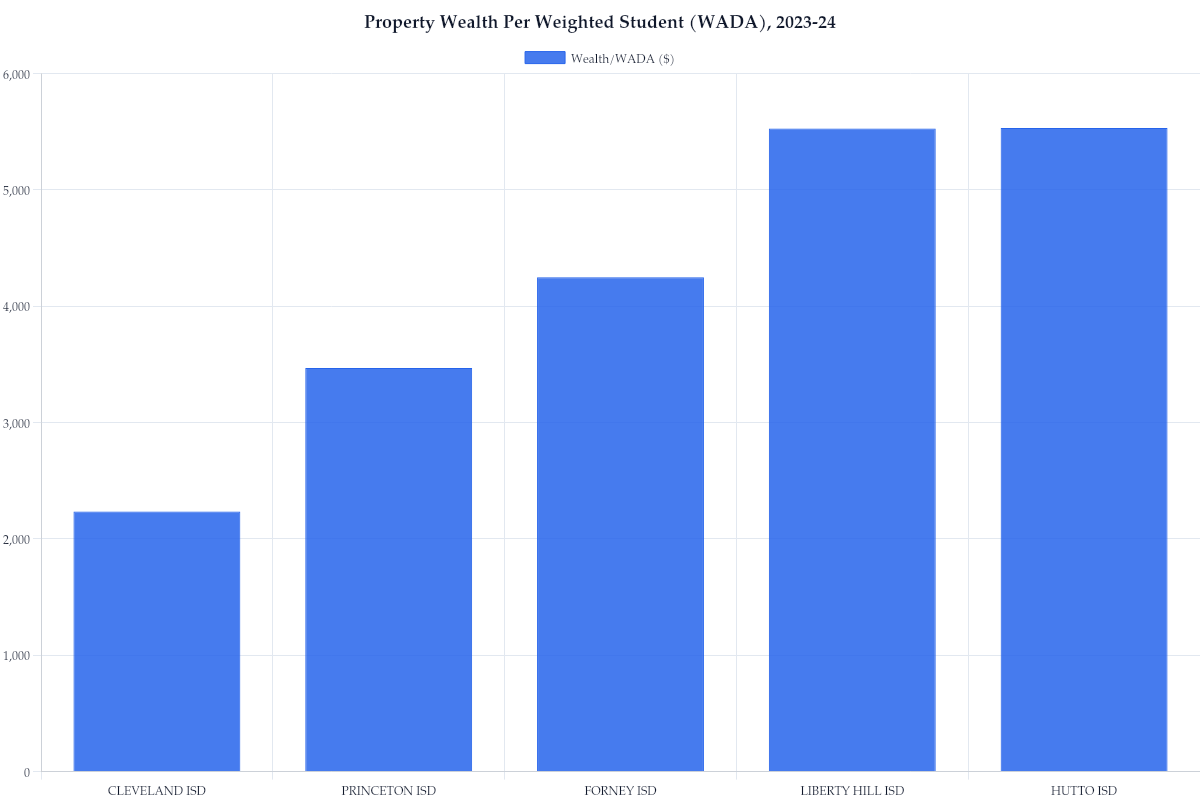
Cleveland ISD spent approximately $118 million from its 2019 bond on the Santa Fe complex ($72.18 million), Pine Burr Elementary ($24.4 million), and an administrative building ($21.6 million). The Santa Fe complex and Pine Burr Elementary were built on Colony Ridge-donated land (Cleveland ISD, PIR #3, 2024). Cleveland ISD's identifiable state facilities funding in FY24 came from $117 in IFA and $224 in EDA, for a total of approximately $341 per student. ILTexas Liberty County's identifiable state facilities funding was approximately $73 per student before HB 2 (TEA, Summary of Finance, 2024). Cleveland ISD's $210,000 in property wealth per weighted student (WADA) places it at the bottom of the comparator group, while Hays CISD ($340,000) and Dripping Springs ISD ($420,000) have nearly double the tax capacity. The IFA mechanism does not adjust for this disparity. The state created two parallel systems and adequately funded neither.
The State's Response: Charter Expansion
In May 2021, Cleveland ISD Superintendent Chris Trotter met with TEA Commissioner Mike Morath to ask for help with the district's facility crisis. Morath called ILTexas superintendent Eddie Conger the same day. Within three days, ILTexas received approval for a charter amendment authorizing 7,000 new seats in the Cleveland area (Texas Monthly, 2022). The typical charter amendment process takes years. SB 2 (2013) transferred charter approval authority from the elected State Board of Education to the appointed Commissioner, removing the democratic check on expansion and enabling the three-day timeline.
On August 9, 2021, ILTexas CFO Cyndi Dworkin told investors that families would be "pointed to an ILTexas school" (ILTexas bond prospectus, 2021). The Cleveland ISD board voted unanimously against the expansion in September 2021. Superintendent Trotter was forced out on November 2, 2021, the same night the latest bond canvass results came in, by a 4-2-1 vote. Kevin Brown of the Texas Association of School Administrators called the ILTexas expansion an "invasion from outsiders" (Texas Monthly, 2022).
ILTexas spent $107.91 million on three Liberty County campuses: BG Ramirez Elementary ($27.3 million), MSG Ramirez Middle ($33.1 million), and Liberty High School ($47.5 million), financed by $108.865 million in Series 2022 revenue bonds through the Clifton Higher Education Finance Corporation (ILTexas, PIR #2/#11, 2024). All land was donated by Colony Ridge. ILTexas received $0 in IFA, $0 in NIFA, and $0 in Charter School Program startup grants for these campuses (TEA, PIR #2502721, 2024). The ILTexas $5.4 million in CSP grants (2017-18) funded Houston, College Station, and Lancaster campuses only; none went to Liberty County.
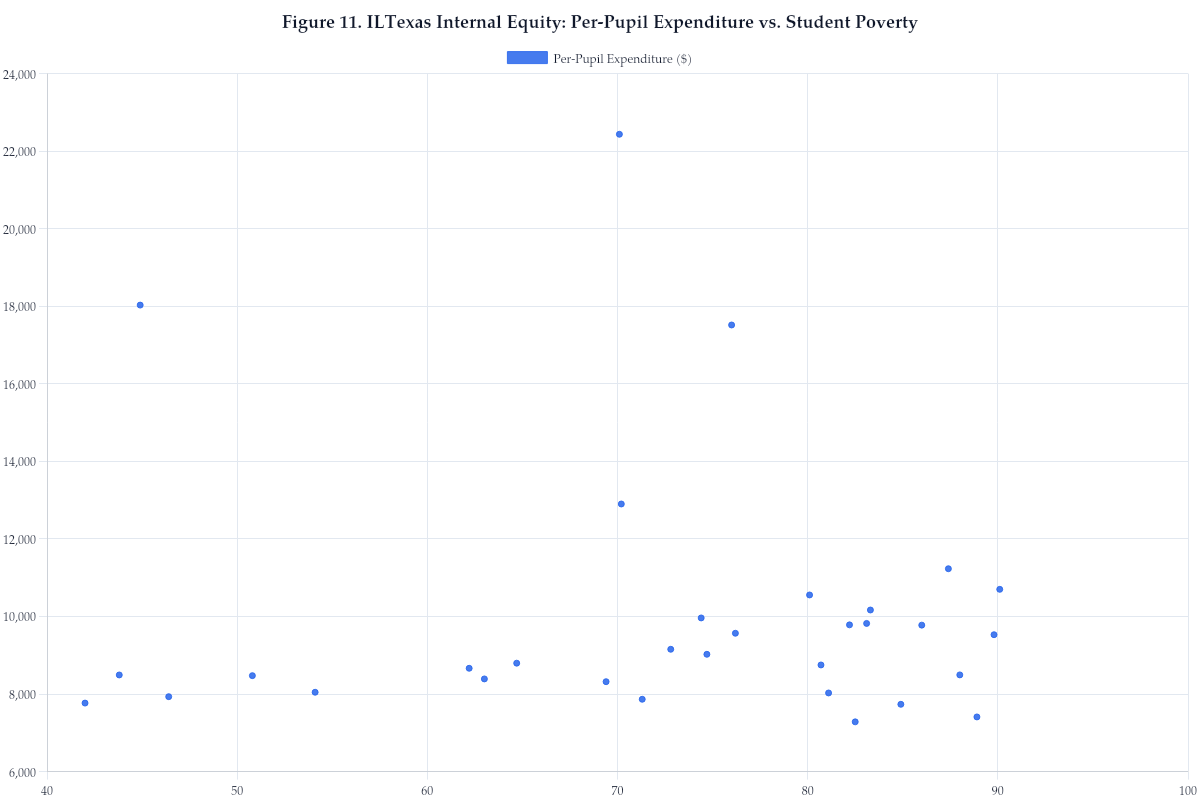
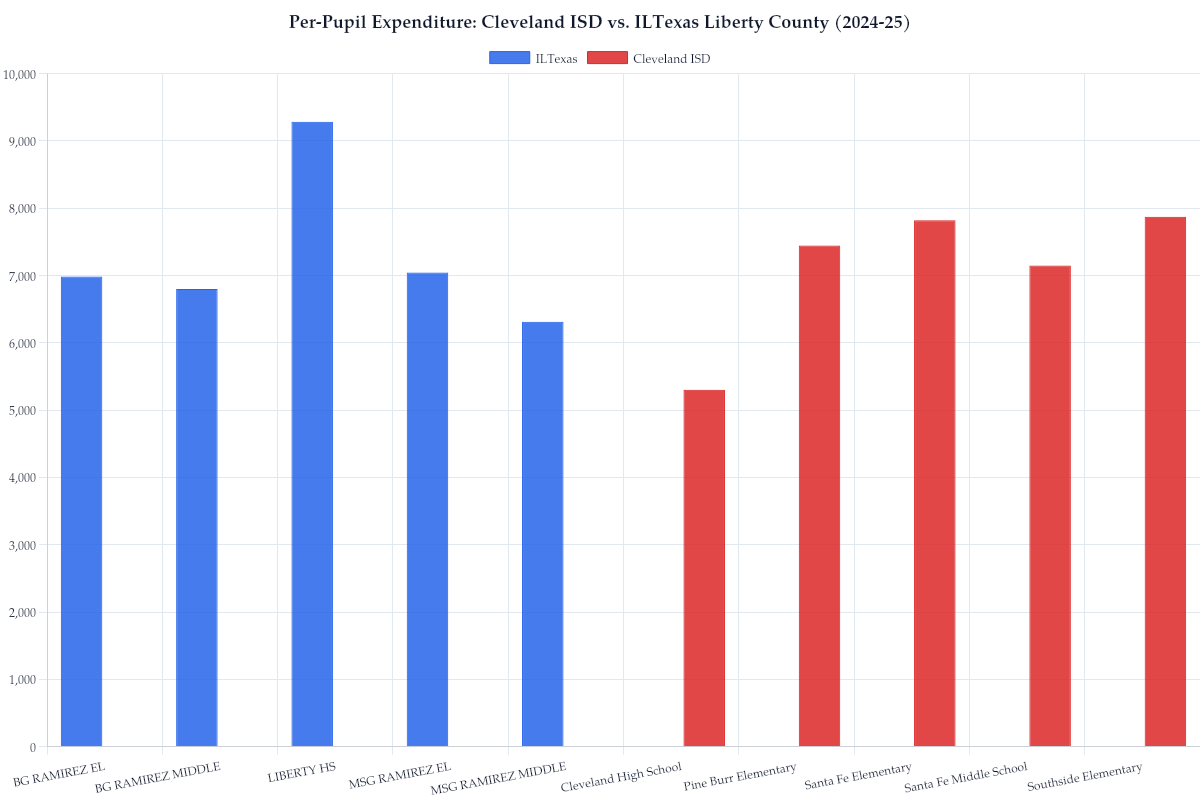
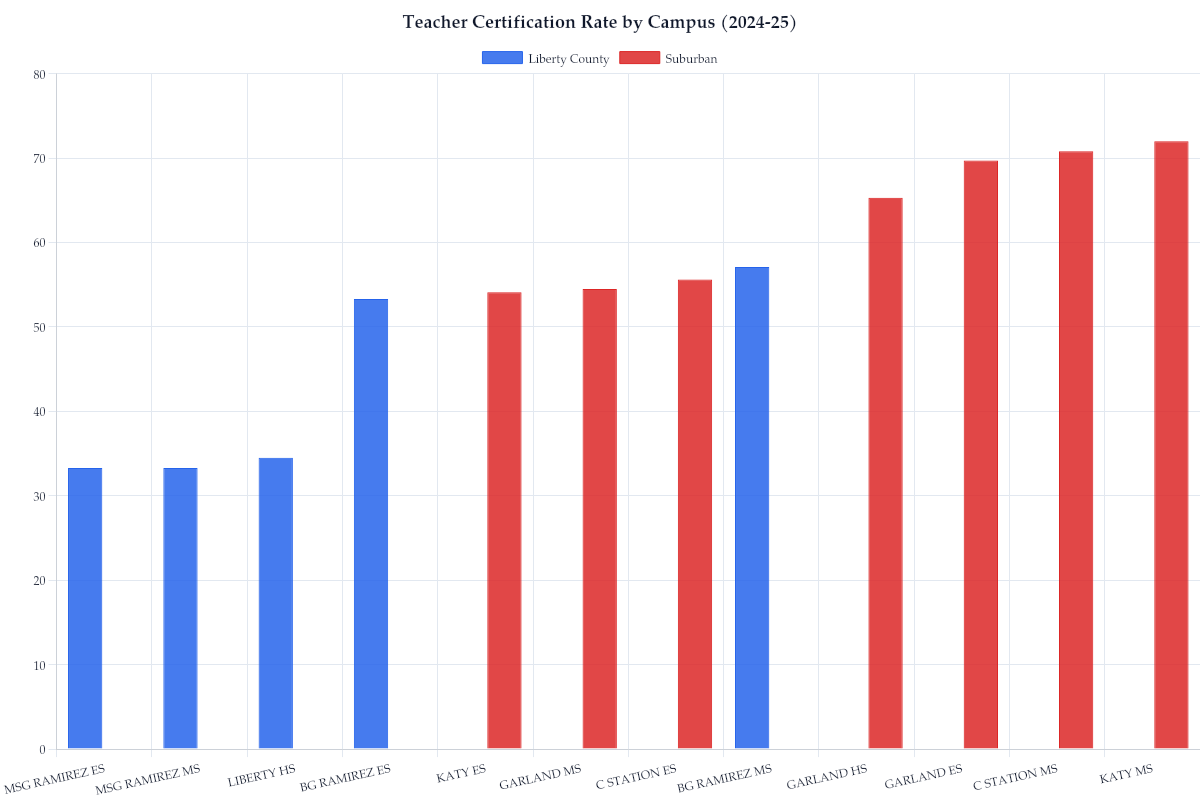
The staffing data at these campuses compounds the concern. ILTexas BG Ramirez Elementary (93% economically disadvantaged, 80% ELL) employs 57% beginning teachers and only 33% hold standard Texas teaching certificates. ILTexas College Station (42% economically disadvantaged, 17% ELL) employs 28% beginning teachers with 66% holding standard certificates (Texas Education Agency, 2024; ILTexas, PIR #11, 2024). The highest-need campuses in the ILTexas network receive the least experienced, least credentialed teachers. ILTexas campus-level financial data from PIR #11 (2026) reveals the resource disparity. MSG Ramirez Middle (95% economically disadvantaged) receives $6,740 per pupil compared to $8,350 at College Station Middle (42% economically disadvantaged), a $1,610 gap per student. BG Ramirez Elementary (93% economically disadvantaged) receives $7,527 per pupil compared to $8,139 at College Station Elementary (42% economically disadvantaged). The highest-need campuses receive less funding per student, fewer certified teachers, and more beginning teachers than the network's suburban campuses. The internal resource allocation within ILTexas replicates the unequal access to funding the Edgewood framework was designed to prevent.
Colony Ridge Campus Drill-Down: Parallel Infrastructure for Identical Populations
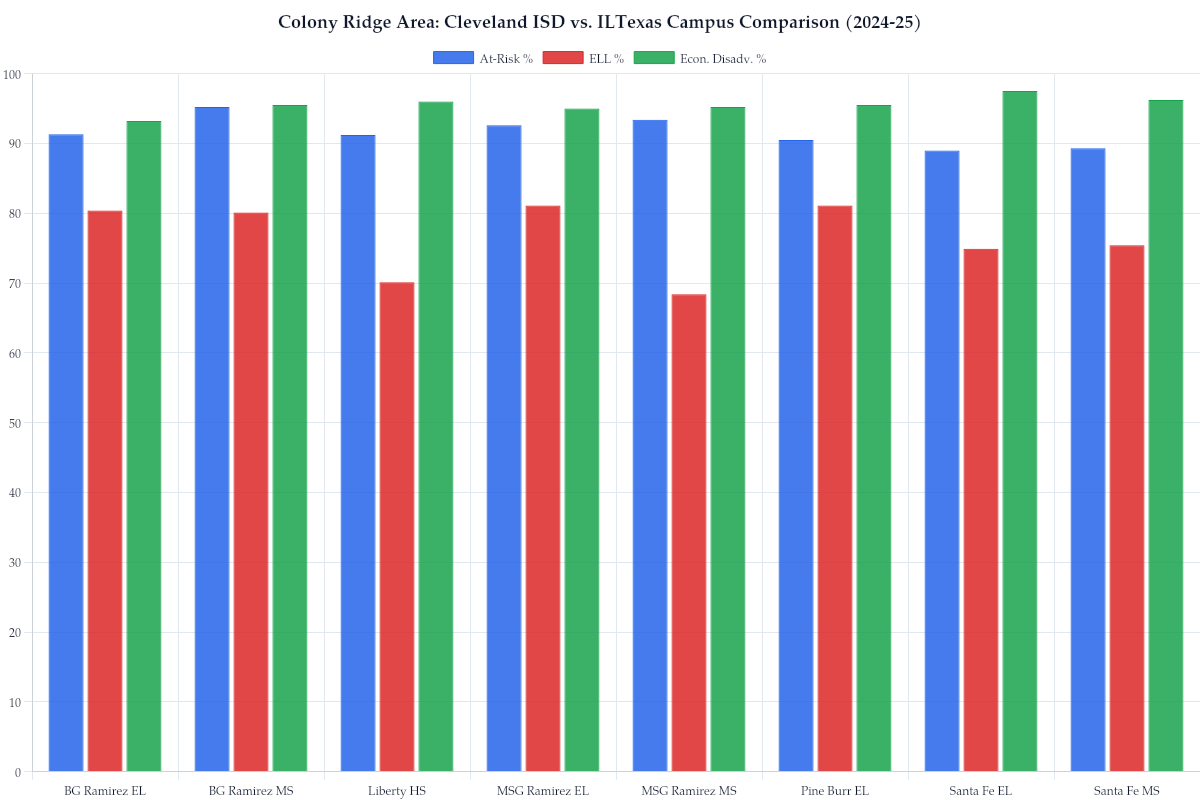
Three Cleveland ISD campuses, Pine Burr Elementary (1,017 students, 90.5% at-risk, 95.5% economically disadvantaged), Santa Fe Elementary (1,072 students, 89.0% at-risk, 97.5% economically disadvantaged), and Santa Fe Middle School (1,117 students, 89.3% at-risk, 96.2% economically disadvantaged), serve the Colony Ridge community directly. Together they enroll 3,206 students (Texas Education Agency, 2024).
Five ILTexas campuses serve a demographically parallel population: BG Ramirez Elementary (888 students, 91.3% at-risk), MSG Ramirez Elementary (895 students, 92.6% at-risk), BG Ramirez Middle (418 students, 95.2% at-risk), MSG Ramirez Middle (455 students, 93.4% at-risk), and Liberty High School (421 students, 91.2% at-risk). Together they enroll 3,077 students (Texas Education Agency, 2024).
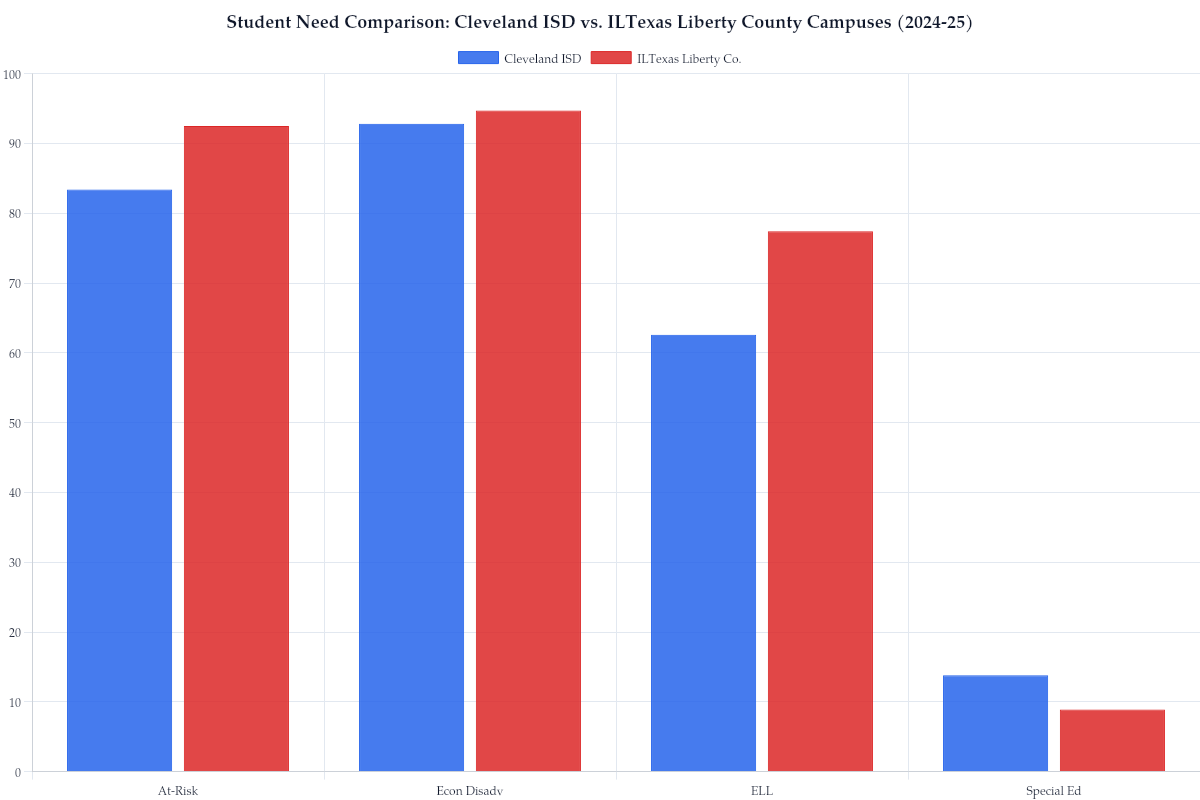
Average at-risk rates differ by 3.1 percentage points (89.6% Cleveland vs. 92.7% ILTexas). Economically disadvantaged rates differ by 1.4 percentage points (96.4% vs. 95.0%). ELL rates differ by less than one percentage point (77.1% vs. 76.0%). The populations are statistically indistinguishable on every ARC risk factor except special education: Cleveland's Colony Ridge campuses serve 13.8% special education students compared to 8.6% at ILTexas Liberty County, a 5.2 percentage point gap consistent with the statewide pattern in which charter schools enroll lower proportions of students with disabilities (Texas Education Agency, 2024).
Combined, the two systems serve 6,283 students from the same Colony Ridge community. The state funds both systems separately. Cleveland ISD's IFA dropped 77% per student over five years. ILTexas received $0 in IFA. MSG Ramirez opened 26 portables within a year of completing its $33.1 million building (ILTexas, PIR #11, 2024). Cleveland ISD operates 186 portables district-wide. Portables cost more per square foot to heat, cool, and maintain than permanent construction. Both systems depend on these higher-cost temporary structures because the funding mechanism cannot match the growth rate. Cleveland ISD's demographer projects every major campus will exceed design capacity by 2030. Southside Elementary is projected to reach 226% of capacity by 2034-35. The one bond that passed ($198 million in November 2019, 53.9% approval) funded three buildings. The four bonds that failed would have funded the remaining capacity gap. The 186 portables are the physical consequence of a $640 million facility investment deficit.
The Statewide Pattern
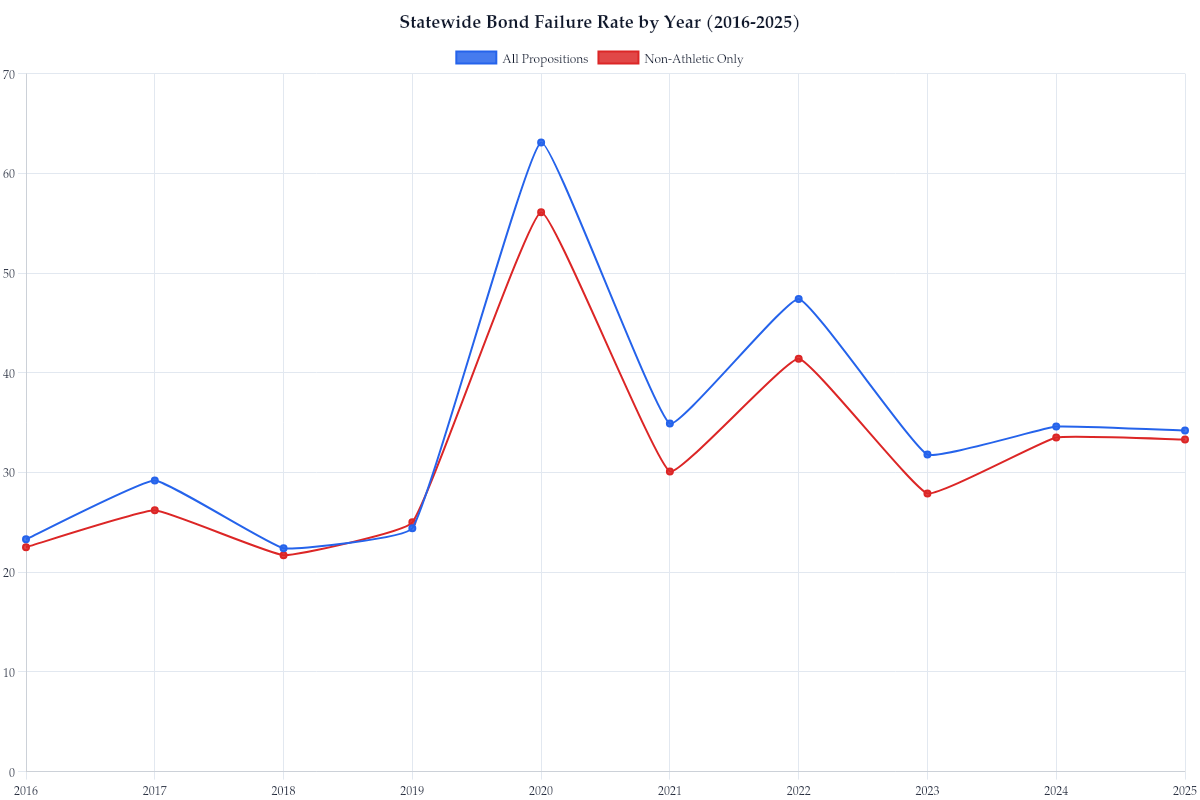
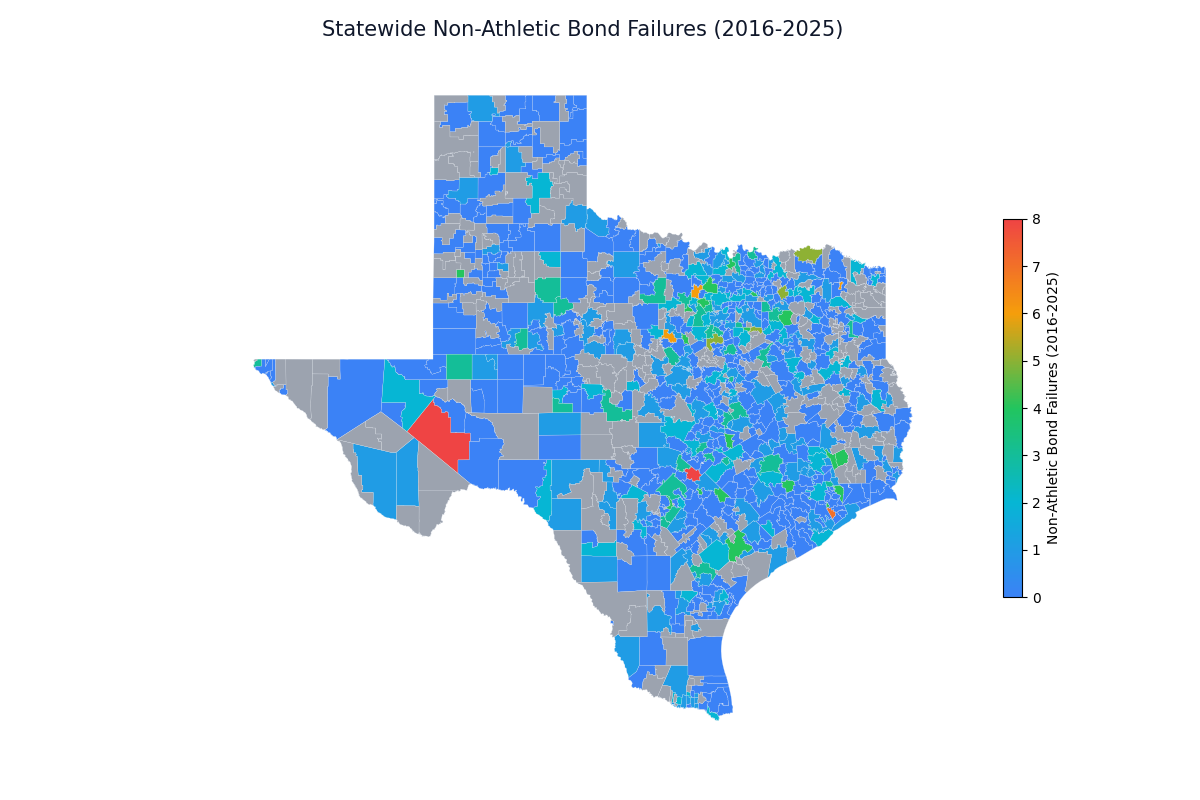
Cleveland ISD is not an outlier. Since 2016, Texas school districts placed 2,067 bond propositions before voters. 738 failed, a 35.7% failure rate. Removing pure athletic propositions (stadiums, natatoriums, athletic complexes) leaves 551 non-athletic failures across 325 districts (Texas Bond Review Board, 2024).
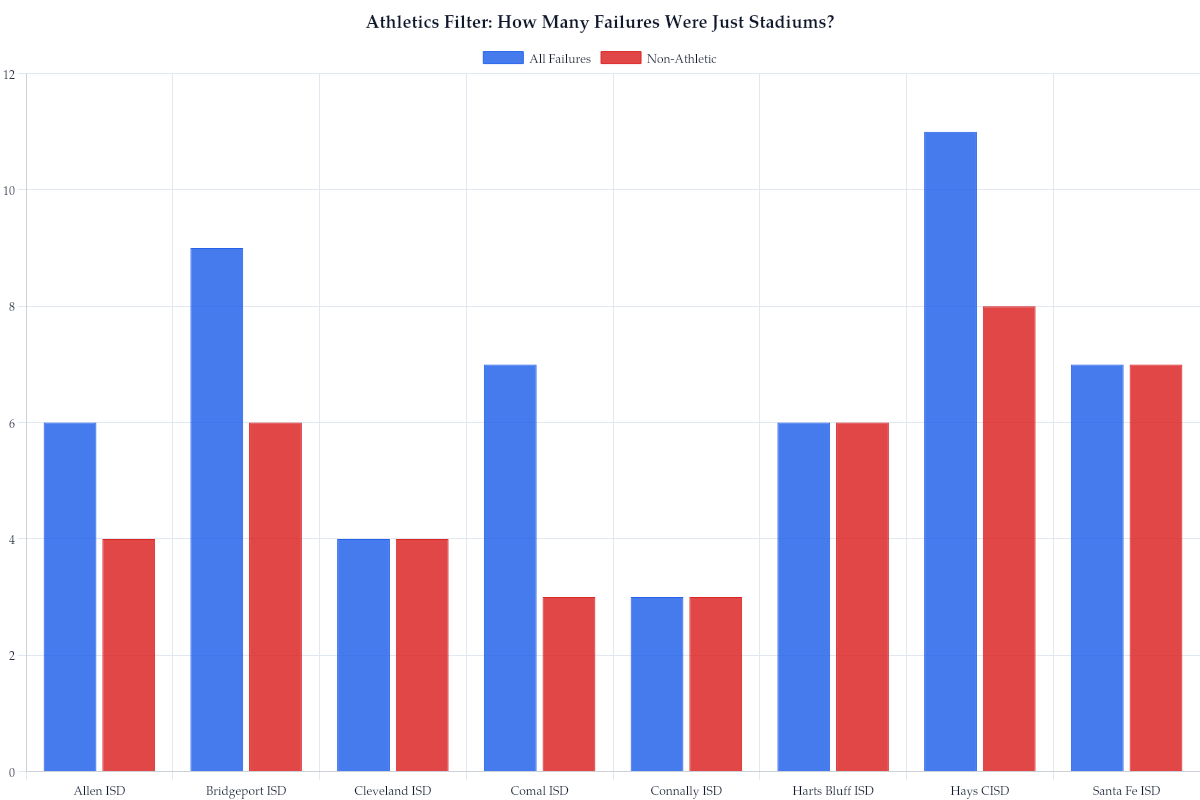
Two populations of bond failure emerge after the athletics filter. Wealthy suburban districts reject stadiums but approve schools: Comal ISD drops from 7 failures to 3 when athletics are removed, Allen ISD drops from 6 to 4. High-poverty districts fail everything: Cleveland ISD stays at 4 of 4 non-athletic failures, Connally ISD (McLennan County) stays at 3 of 3 with 80.5% poverty and 70.3% at-risk, Harts Bluff ISD (Titus County) stays at 6 of 6 with 63.9% economically disadvantaged and 33.4% ELL. Dublin ISD (Erath County) stays at 3 of 3 with 77.2% economically disadvantaged. The voter is making an informed choice in the wealthy suburb (yes to schools, no to stadiums). The voter in the high-poverty district is rejecting the school building itself (Texas Education Agency, 2024).
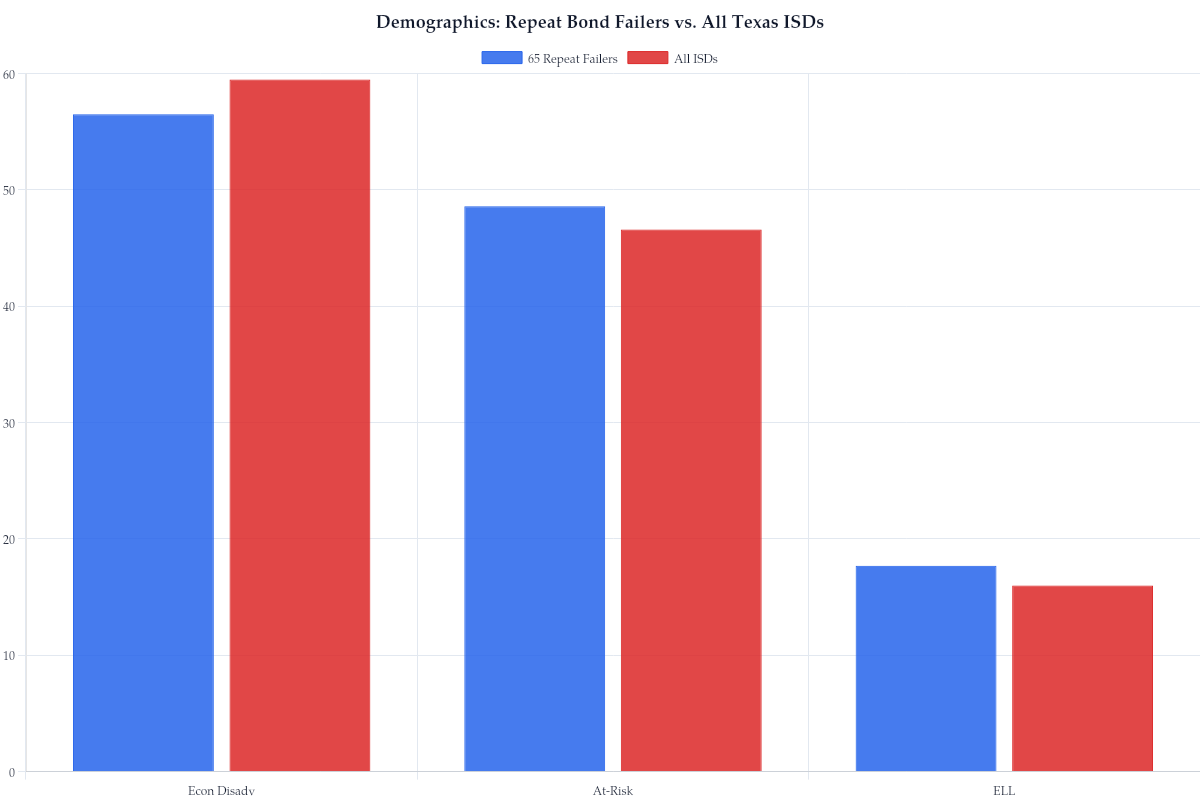
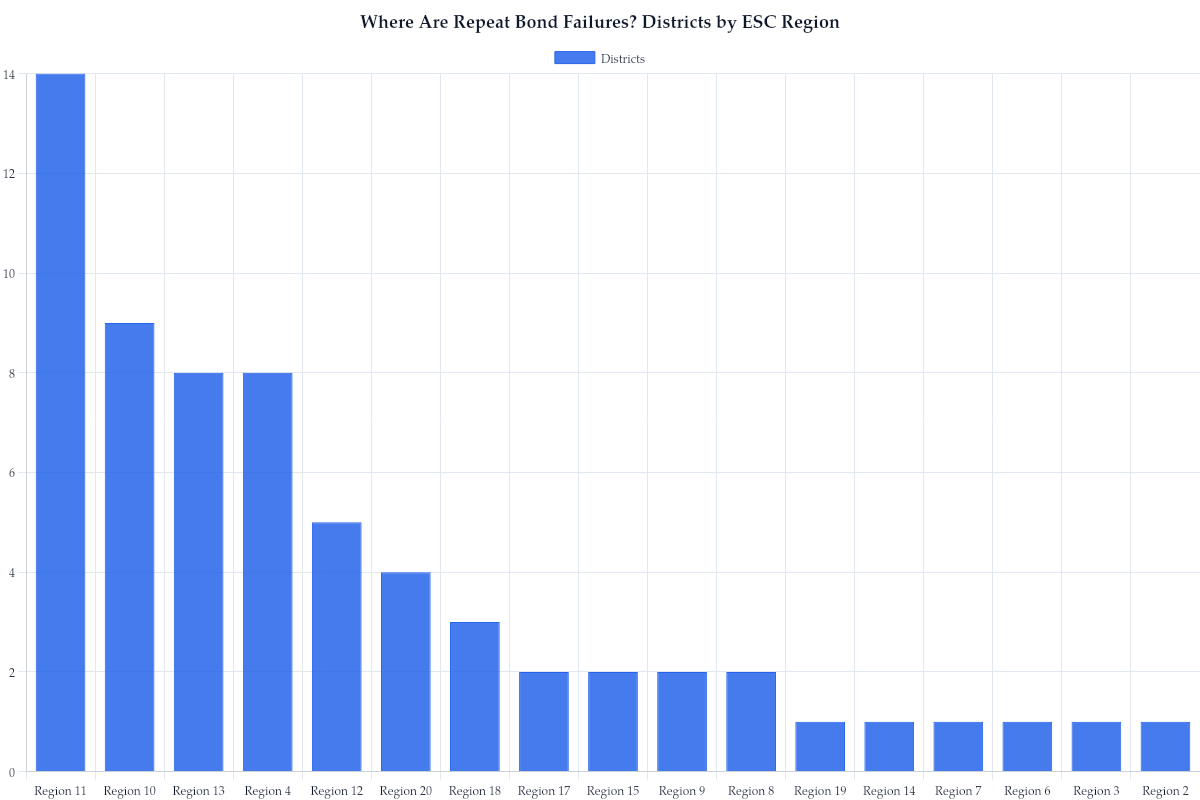
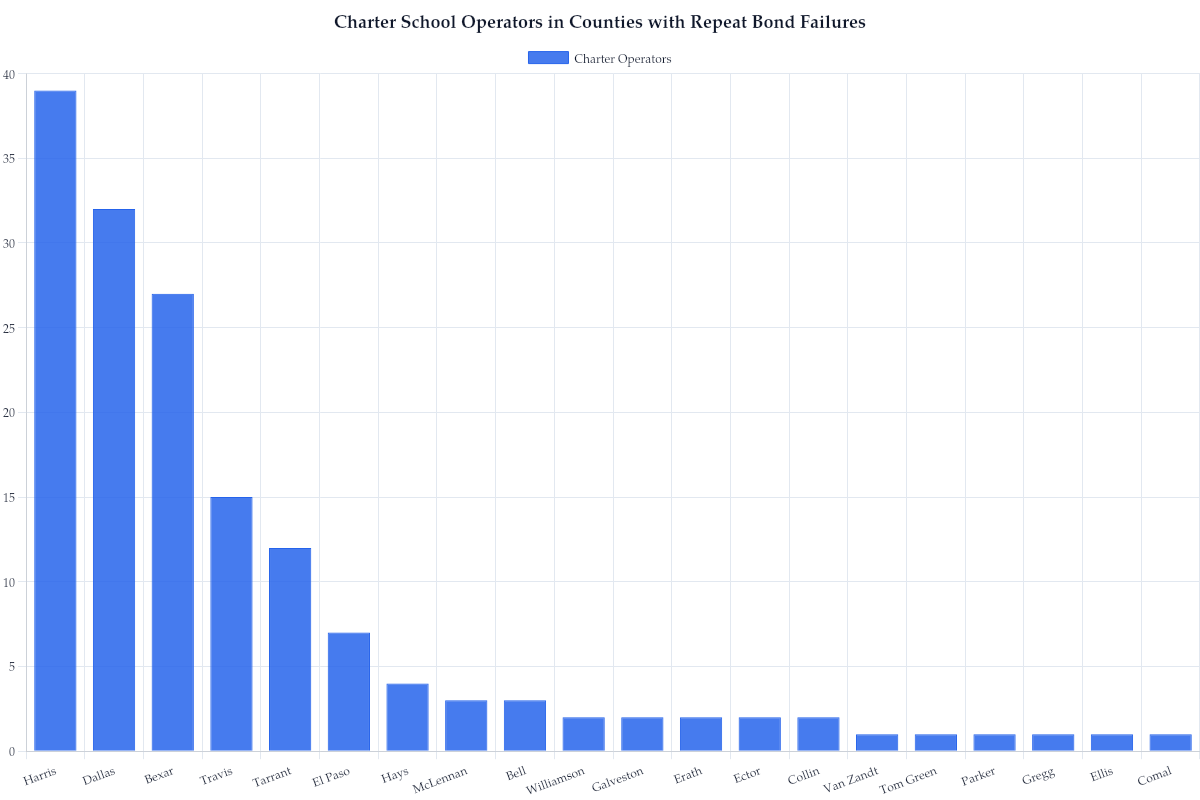
Ten districts have 3 or more non-athletic failures since 2016 and zero non-athletic passes. Harts Bluff ISD (Titus County) failed 6. Bridgeport ISD (Wise County) failed 6. Tarkington ISD (Liberty County) failed 4. These 10 districts attempted 39 non-athletic bond propositions since 2016 and passed zero. Six of the 10 are in ESC Regions 11 and 12, the Fort Worth-Waco exurban growth belt (Texas Bond Review Board, 2024). Five of eight counties containing locked-out districts have zero charter school operators. The state's charter expansion strategy does not reach most of the districts where the bond mechanism has failed.
Houston ISD illustrates the bond mechanism failure at scale. Commissioner Morath appointed Mike Miles as HISD superintendent in June 2023 after a four-year state takeover litigation. Miles proposed a $4.4 billion bond that failed on November 5, 2024, with 58% opposed, the first Texas bond over $1 billion to be rejected (Houston Chronicle, 2024). Voter trust in the mechanism breaks down when state-appointed leadership replaces local governance. In 2026, HISD's state-appointed Board of Managers considered outsourcing management at four high-performing campuses and pre-K programs (Houston Chronicle, 2026). IDEA also attempted a charter amendment to enter the Cleveland ISD service area in 2020 (amendment 059-20/3). TEA denied the application. ILTexas succeeded one year later under the three-day timeline, despite its campuses not meeting minimum academic accountability standards. The distinction between the two charter operators' outcomes rested on Commissioner discretion rather than any statutory criteria.
Constitutional Analysis
The Edgewood I (1989) standard requires substantially equal access to revenue for similar tax effort. Cleveland ISD and its four comparator districts share the same bond election process and state funding formulas. The comparator districts authorized $4.630 billion while Cleveland secured only $198 million. The mechanism's dependence on local voter approval means that communities with anti-growth sentiment, racialized opposition, or concentrated poverty can become systematically locked out of facility funding, producing the unequal outcomes Edgewood prohibited.
The Morath (2016) suitability standard requires structural soundness. When Cleveland ISD's superintendent asked Commissioner Morath for help, the state sent charter schools instead of addressing the broken funding mechanism. ILTexas Liberty County campuses serve 92.7% at-risk students with 55-57% beginning teachers and 33-42% holding Texas teaching certificates, compared to 59-66% at ILTexas suburban campuses in Katy and College Station (Texas Education Agency, 2024; ILTexas, PIR #11, 2024). Routing around a broken mechanism with underqualified staffing at the highest-need campuses and providing thousands less in PPE compared to suburban counterparts gives the appearance of state sponsored exploitation rather than structural soundness.
The macro lens finds that statewide, 551 non-athletic bond failures across 325 districts since 2016 represent $12.3 billion in rejected facility investment. The 10 locked-out districts (zero non-athletic passes, 39 failed propositions) serve an average at-risk rate of 52.3%, compared to the state average of 45.9%. Evidence suggests the bond mechanism fails where concentrated poverty, anti-growth sentiment, and racialized opposition converge.
The 1986 Accountable Costs committee recommended that the state assume responsibility for equalized construction funding, recognizing that property-poor districts could not fund facilities through local bonds alone (Texas Education Agency & Accountable Costs Advisory Committee, 1986). Rather than following the committee's recommendation, the Legislature created IFA and EDA. Thirty-eight years later, IFA appropriations have fallen 67%, the guaranteed yield has been frozen for 25 years, and 10 districts have no access to voter-approved bonds at all. The committee's recommendation remains unimplemented.
SQ3 asked whether the bond election mechanism meets the constitutional standard of equal access to facility funding. Cleveland ISD's 4-of-5 failure rate demonstrates that the mechanism produces systematically unequal outcomes correlated with poverty concentration and demographic composition. The state's response of routing around the broken mechanism through charter expansion compounds the failure. Cleveland ISD's 186 portable buildings, serving 12,513 students in a district projected to reach 23,558 by 2034-35, are the physical evidence of a constitutional obligation unmet.
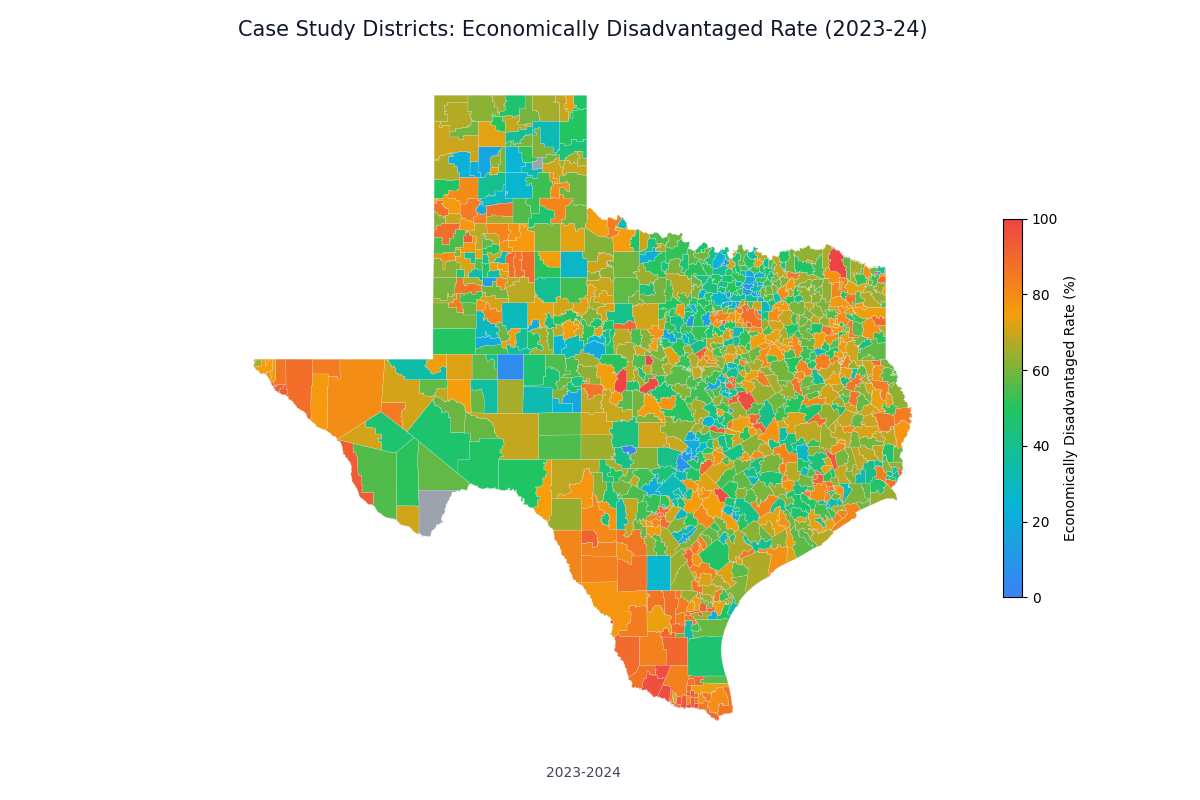
Case Study Districts: Economically Disadvantaged Rate (2023-24)
Enrollment Growth: Total Students by District (2020-2025)
At-Risk Student Rate by District (2020-2025)
English Language Learner (ELL) Rate by District (2020-2025)
Total Bond Amounts Authorized by Voters (Since 2016)
Bond Election Pass Rate: Propositions Approved (Since 2016)
Bond Propositions Since 2019: Dollar Amount by Outcome
Property Wealth Per Weighted Student (WADA), 2023-24
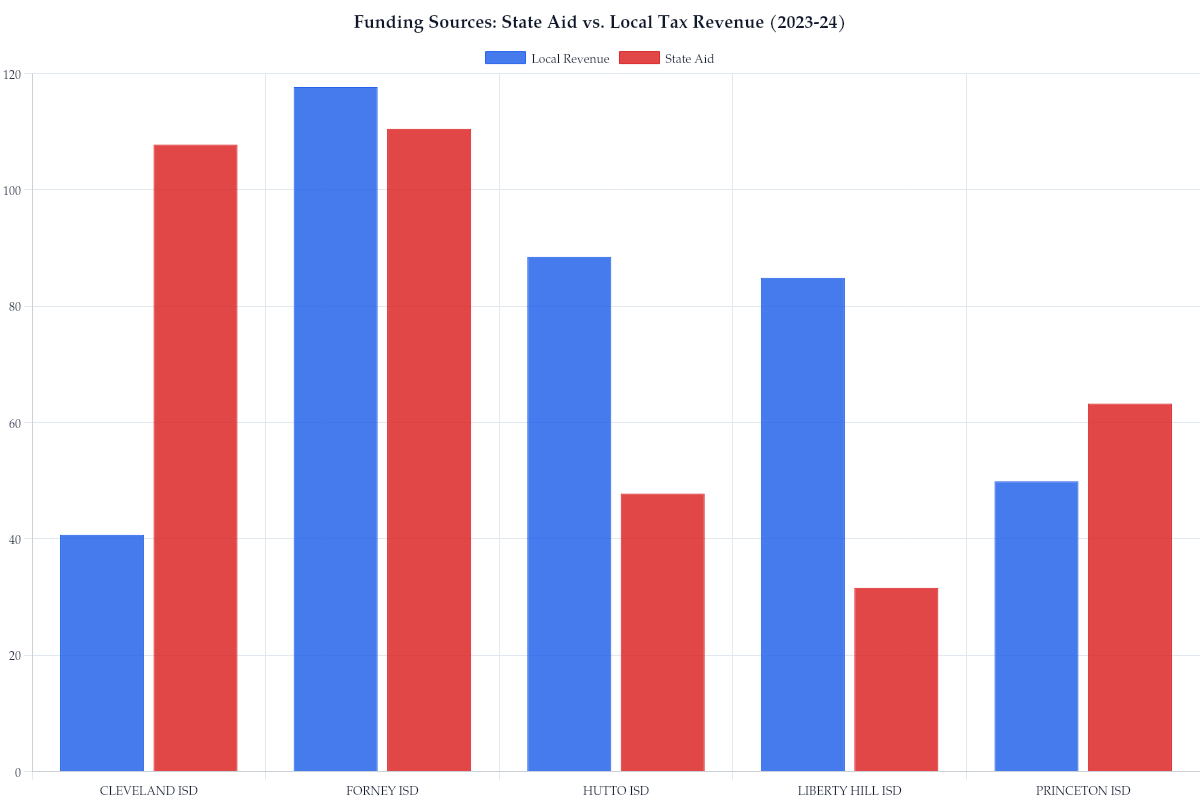
Funding Sources: State Aid vs. Local Tax Revenue (2023-24)
Cleveland ISD Bond Election Results by Precinct
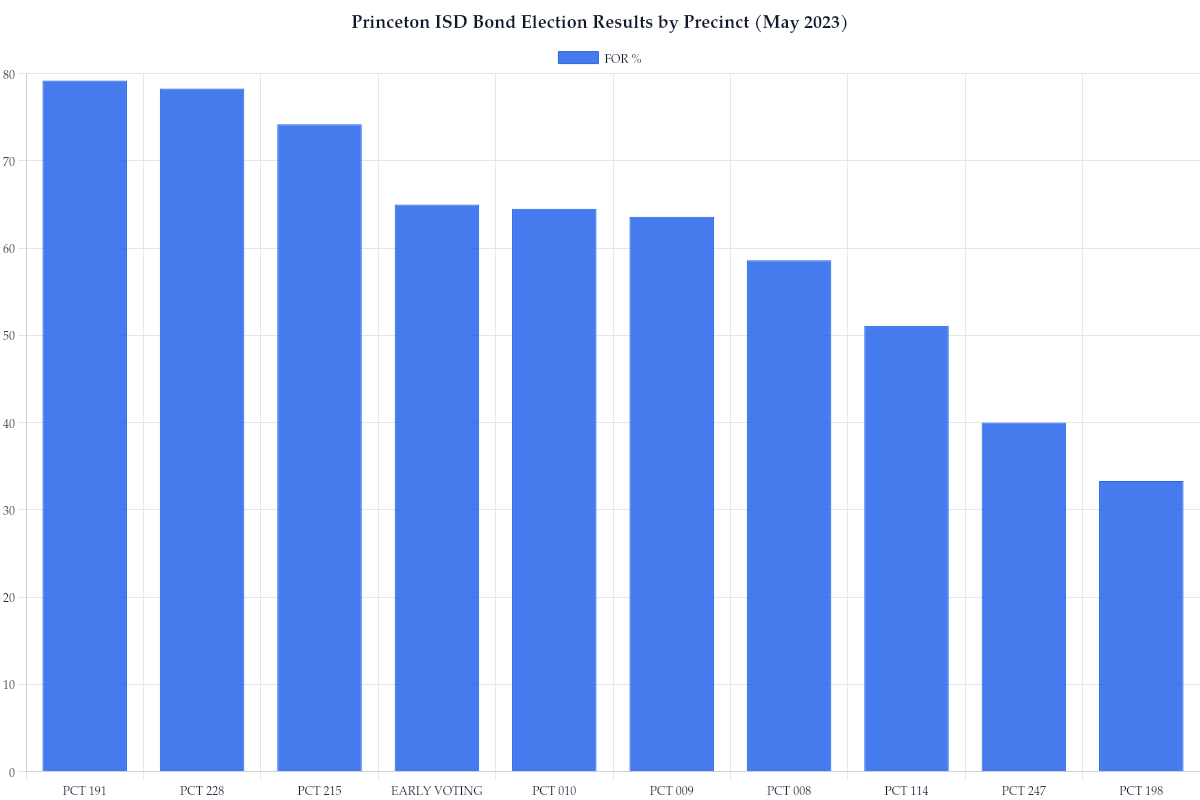
Princeton ISD Bond Election Results by Precinct (May 2023)
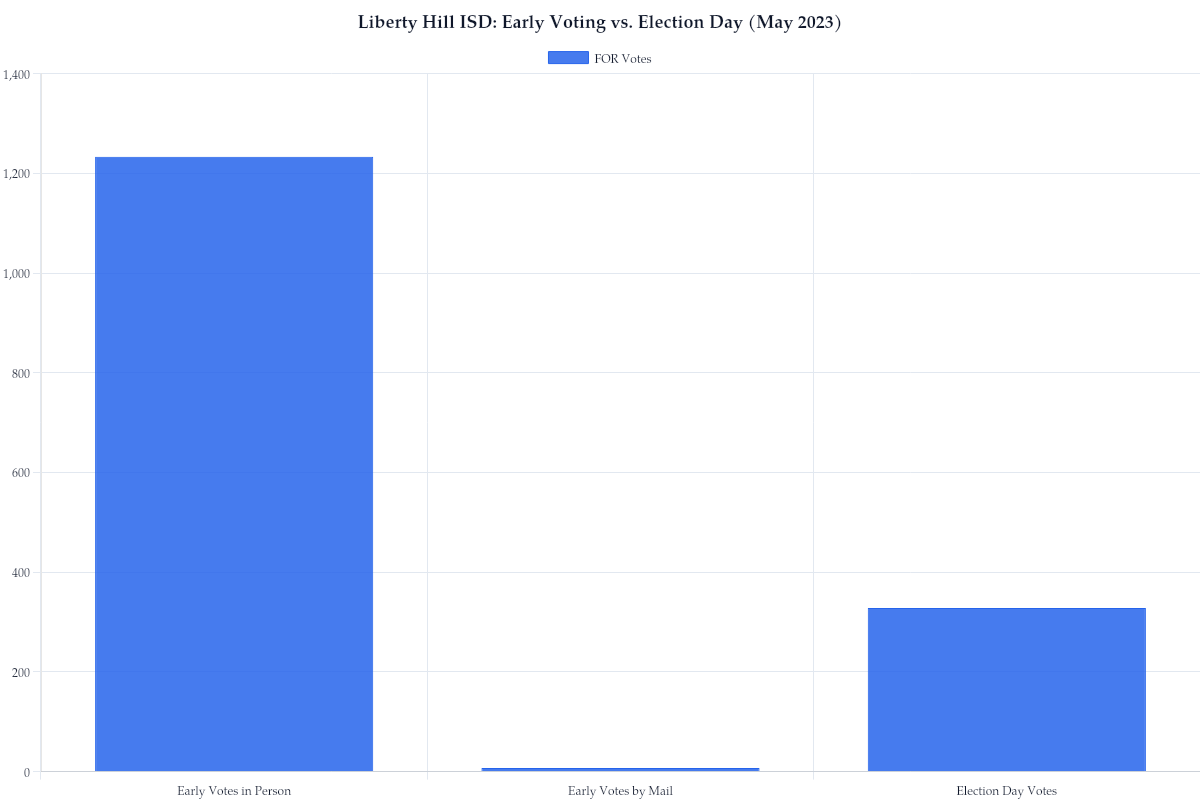
Liberty Hill ISD: Early Voting vs. Election Day (May 2023)
Student Need Comparison: Cleveland ISD vs. ILTexas Liberty County Campuses (2024-25)
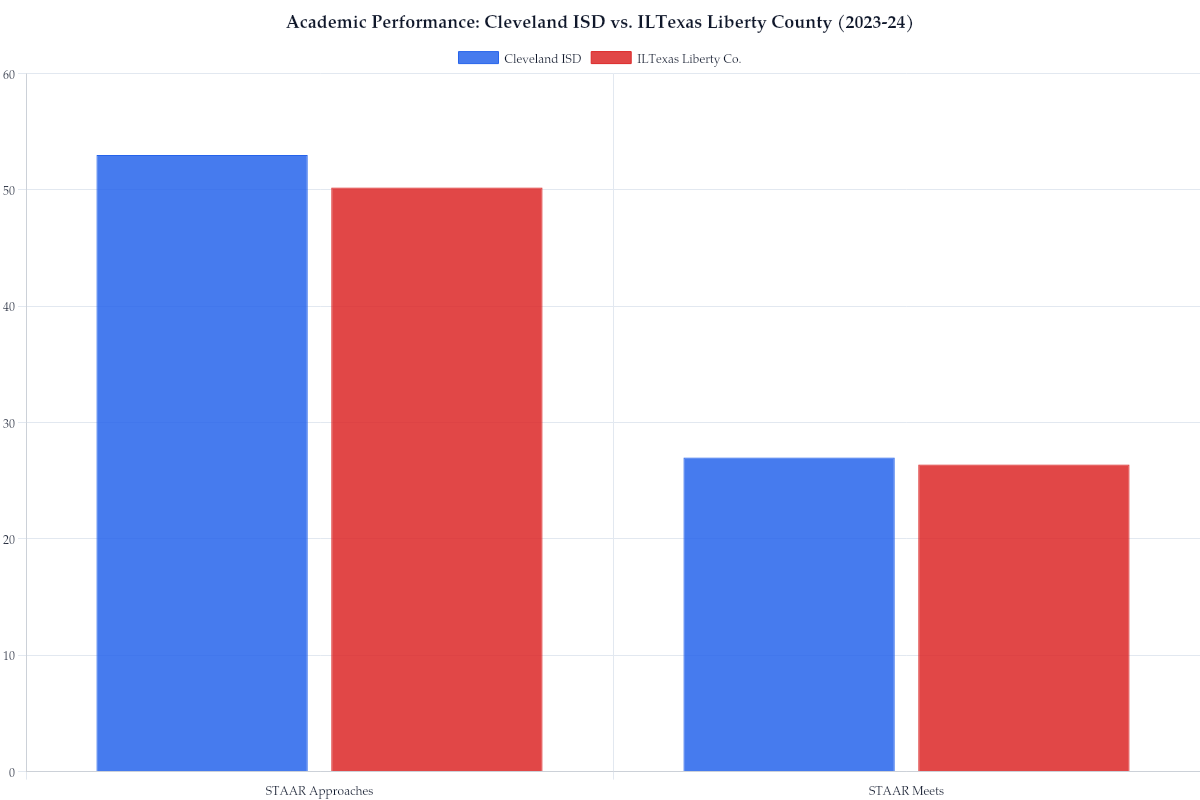
Academic Performance: Cleveland ISD vs. ILTexas Liberty County (2023-24)
ILTexas Campuses Ranked by Student Poverty Rate (2023-24)
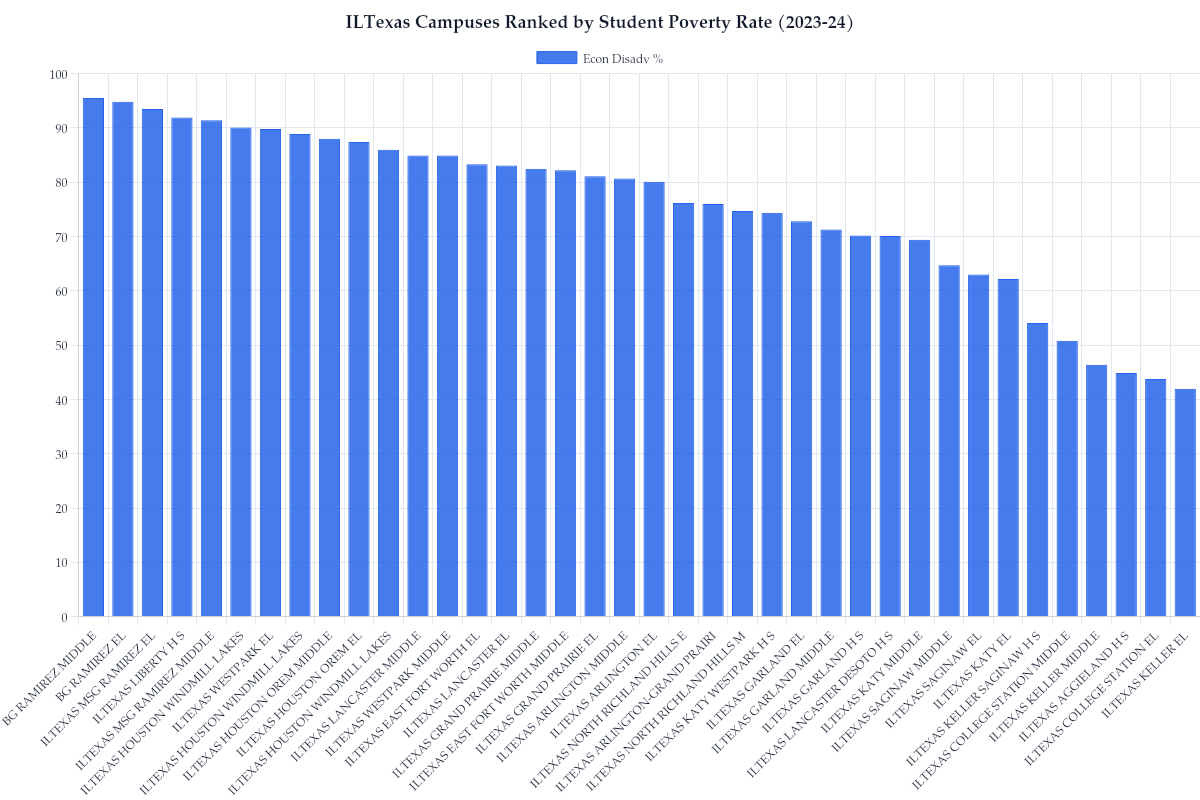
Figure 11. ILTexas Internal Equity: Per-Pupil Expenditure vs. Student Poverty
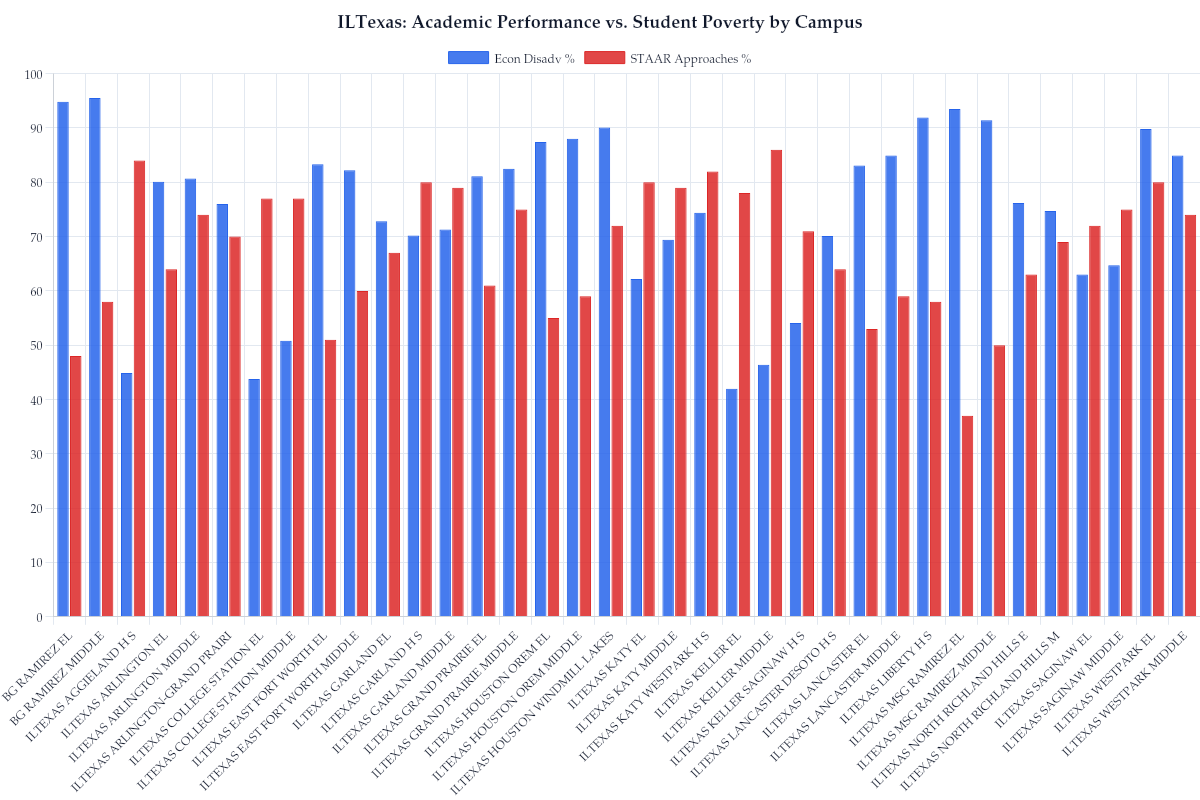
ILTexas: Academic Performance vs. Student Poverty by Campus
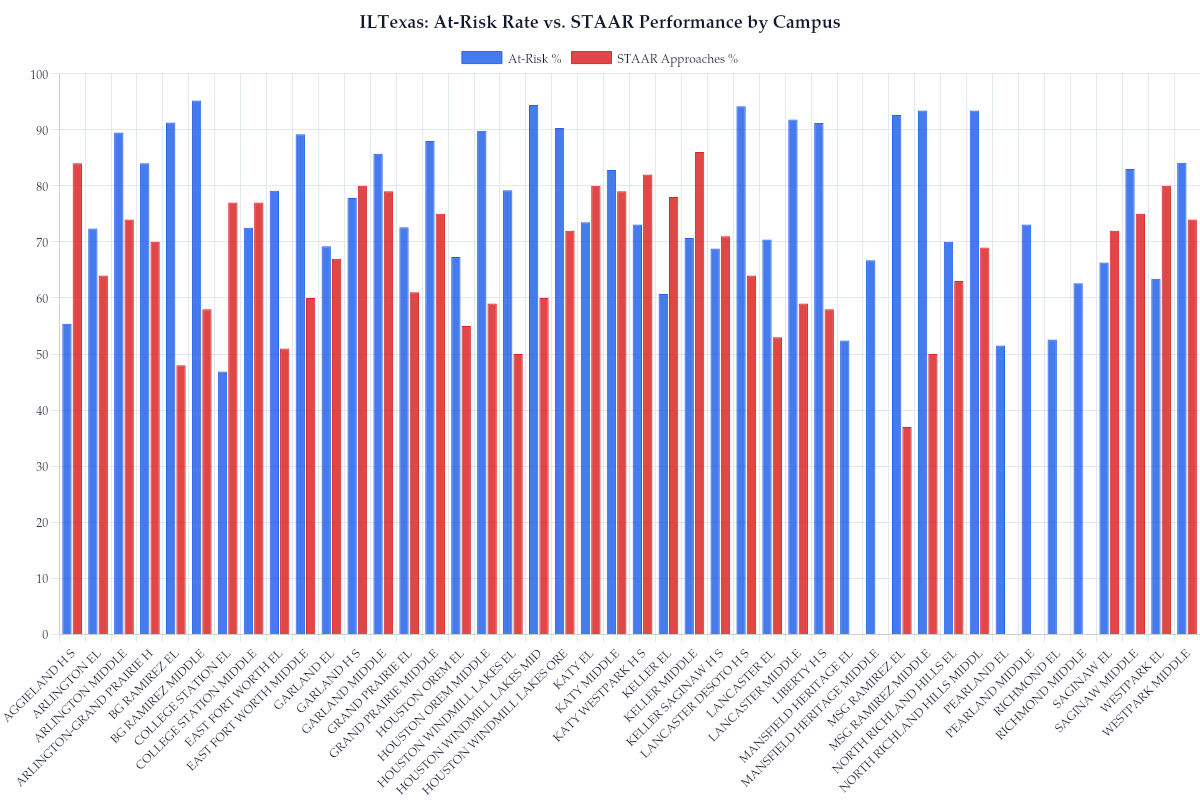
ILTexas: At-Risk Rate vs. STAAR Performance by Campus
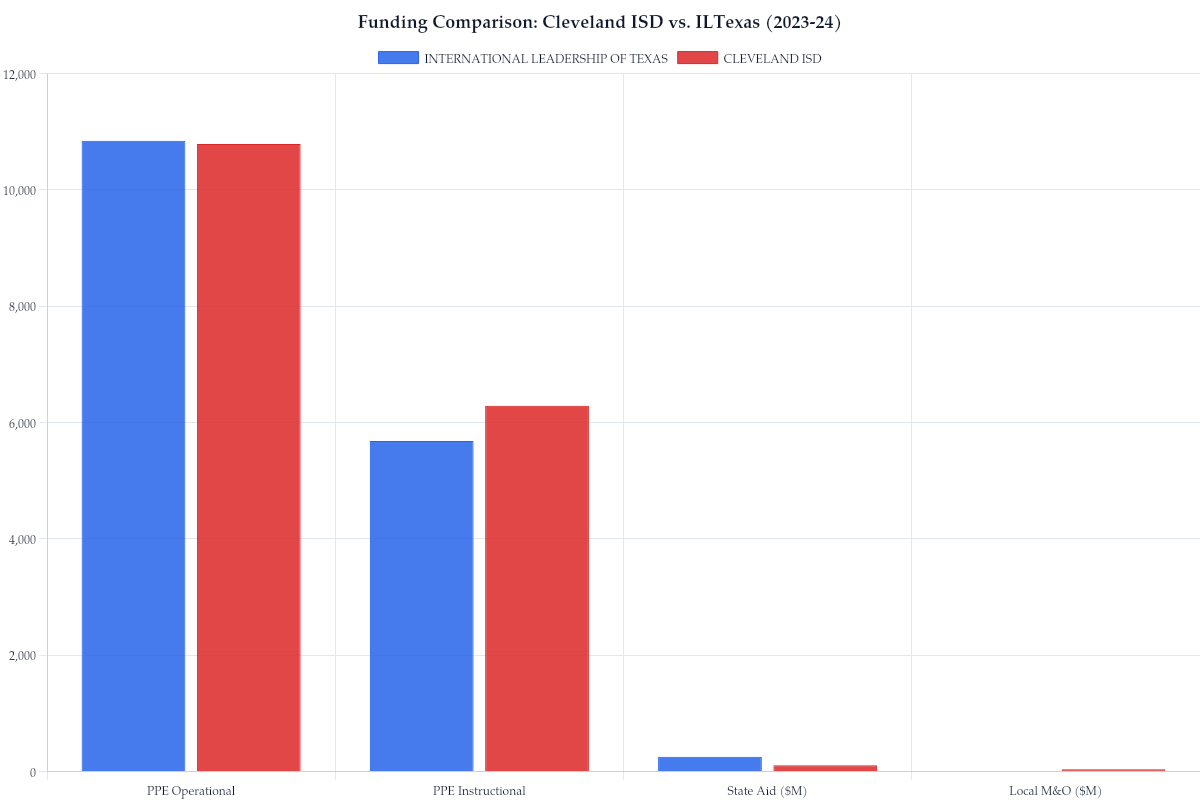
Funding Comparison: Cleveland ISD vs. ILTexas (2023-24)
Colony Ridge Area: Cleveland ISD vs. ILTexas Campus Comparison (2024-25)
Per-Pupil Expenditure: Cleveland ISD vs. ILTexas Liberty County (2024-25)
Teacher Certification Rate by Campus (2024-25)
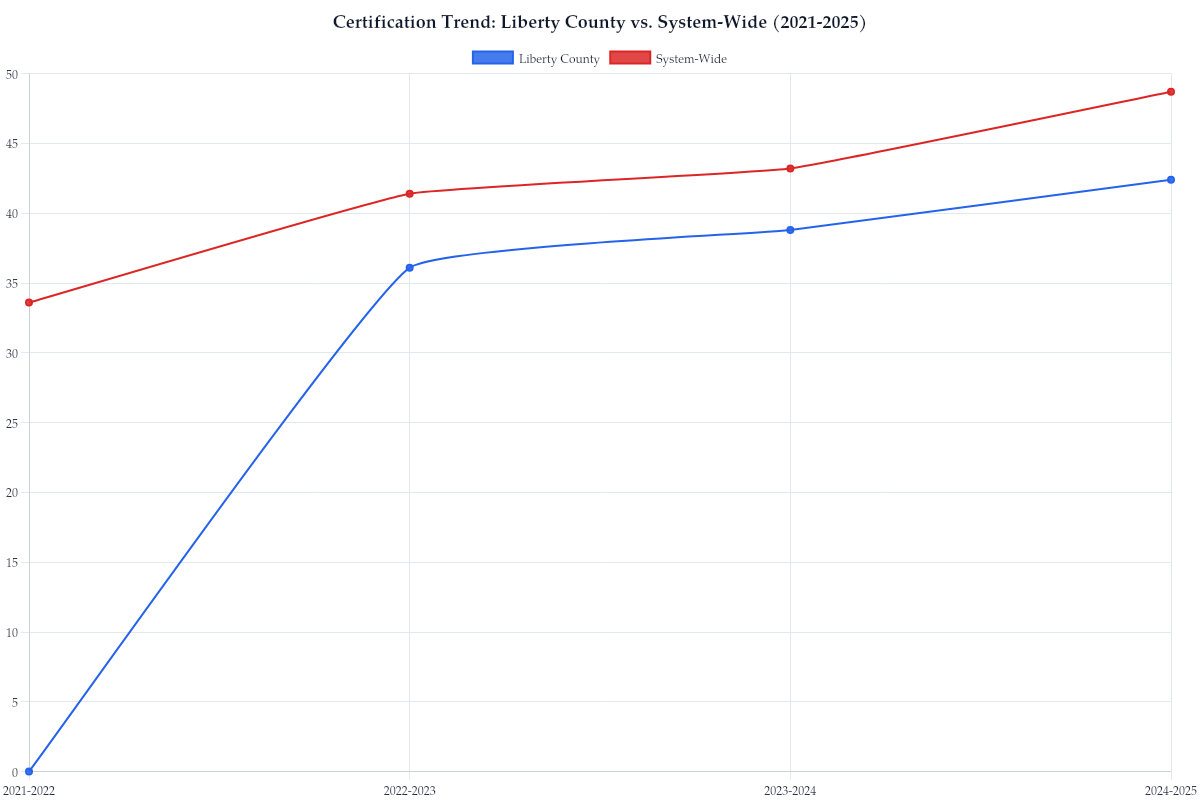
Certification Trend: Liberty County vs. System-Wide (2021-2025)
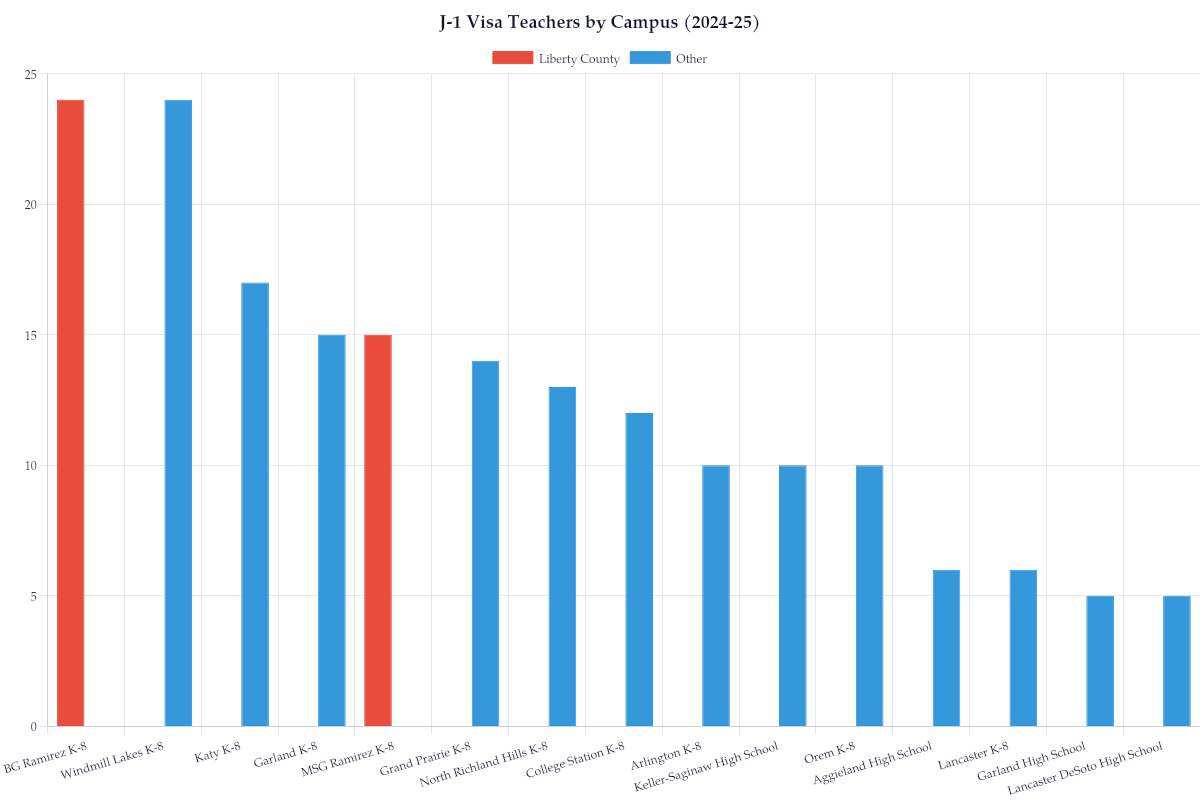
J-1 Visa Teachers by Campus (2024-25)
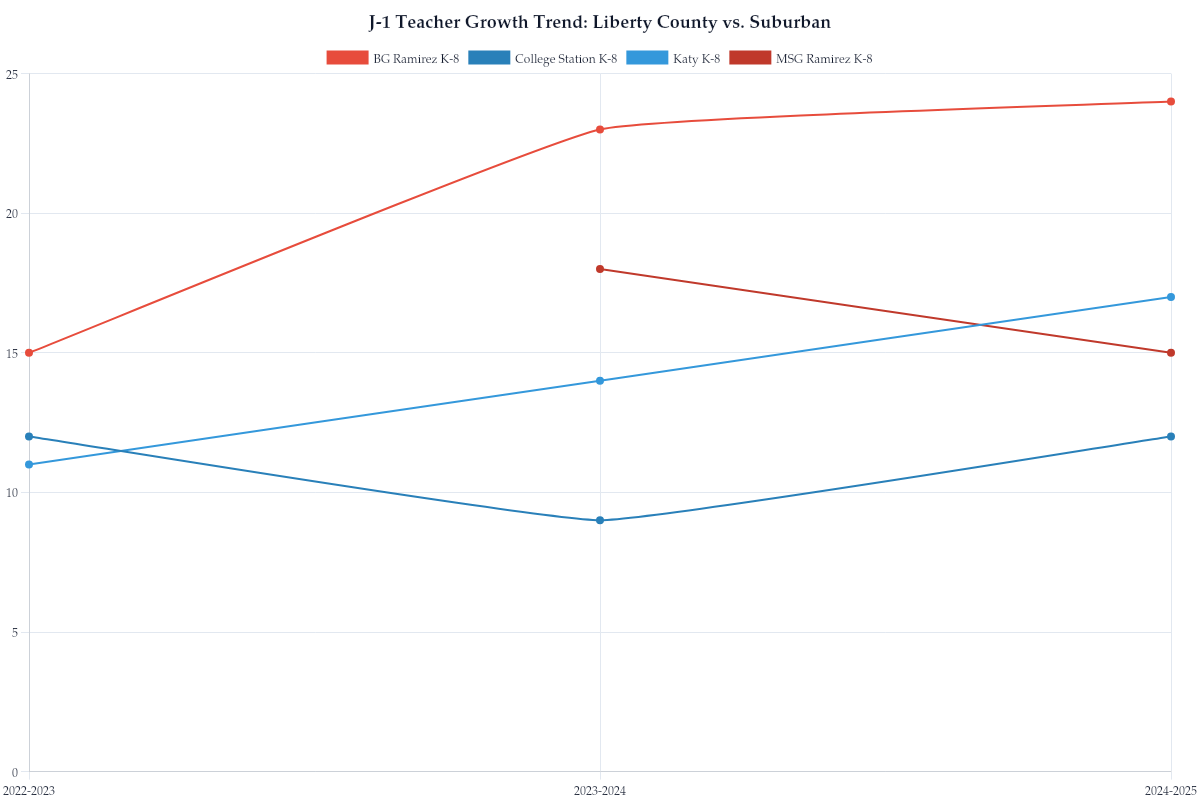
J-1 Teacher Growth Trend: Liberty County vs. Suburban
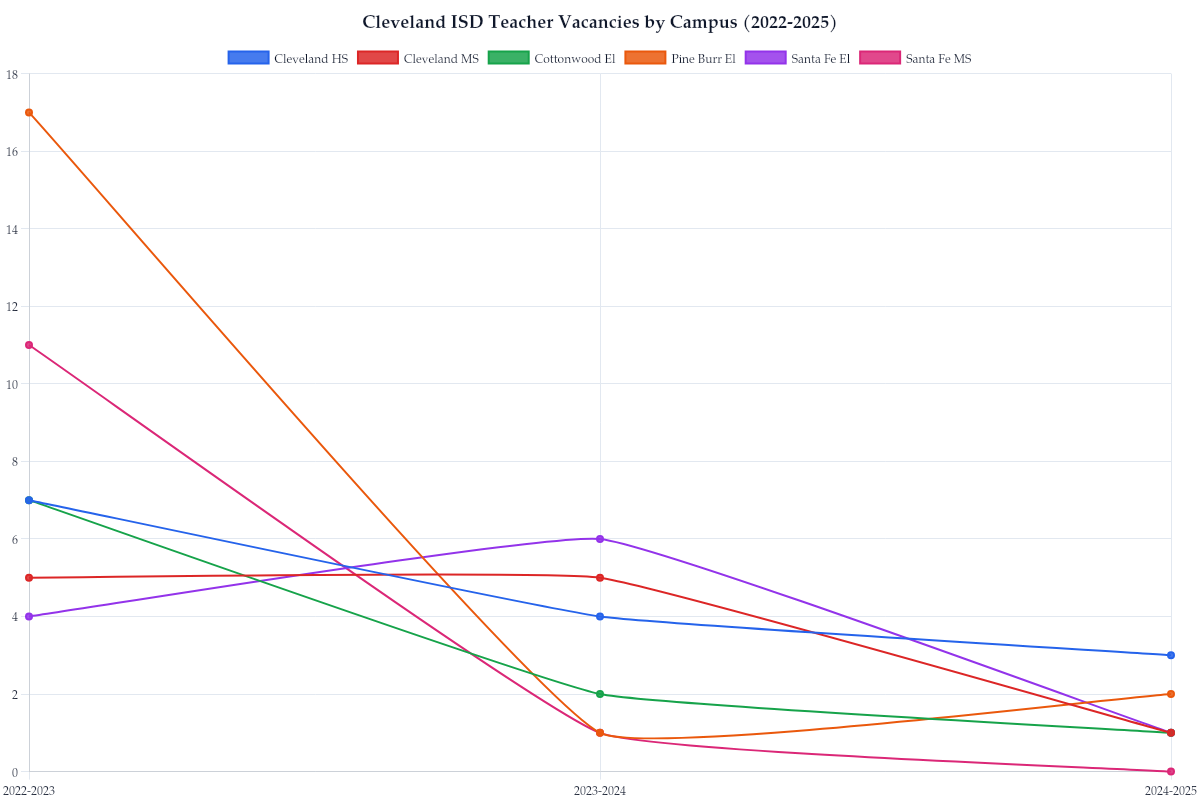
Cleveland ISD Teacher Vacancies by Campus (2022-2025)
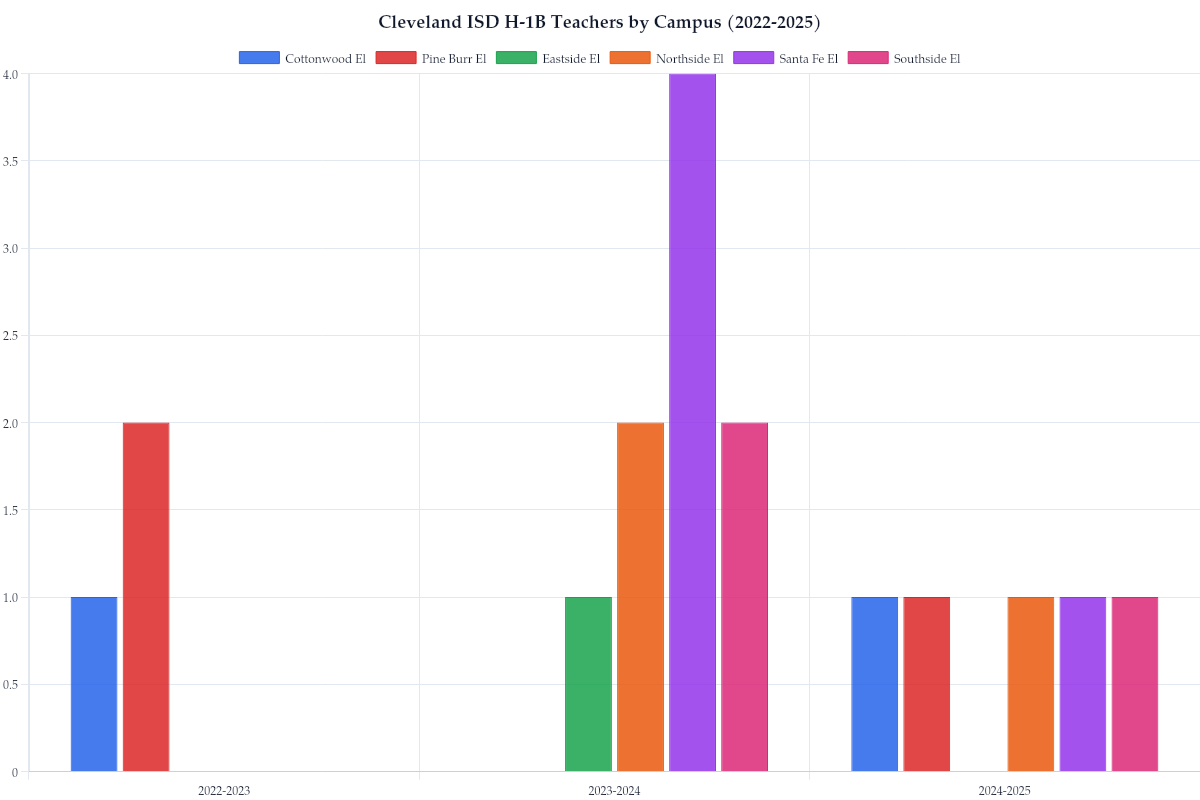
Cleveland ISD H-1B Teachers by Campus (2022-2025)
Statewide Bond Failure Rate by Year (2016-2025)
Athletics Filter: How Many Failures Were Just Stadiums?
Demographics: Repeat Bond Failers vs. All Texas ISDs
Where Are Repeat Bond Failures? Districts by ESC Region
Charter School Operators in Counties with Repeat Bond Failures
Statewide Non-Athletic Bond Failures (2016-2025)
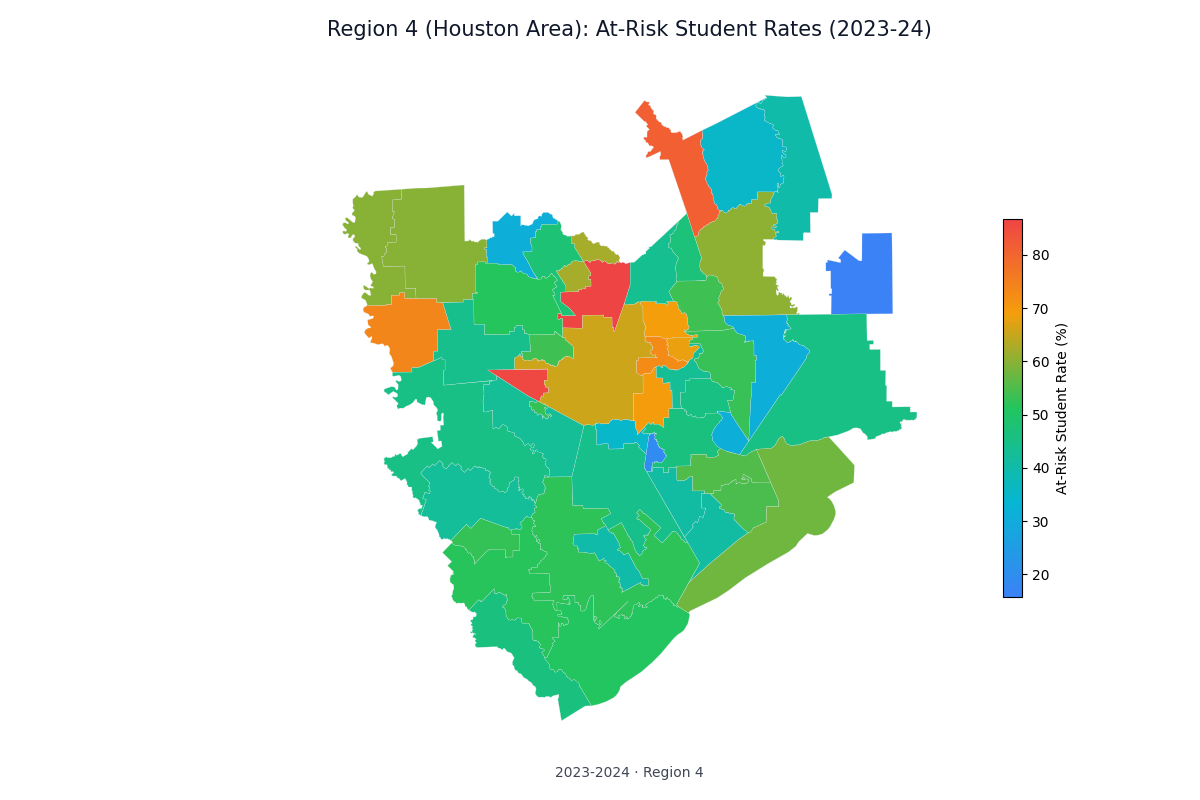
Region 4 (Houston Area): At-Risk Student Rates (2023-24)
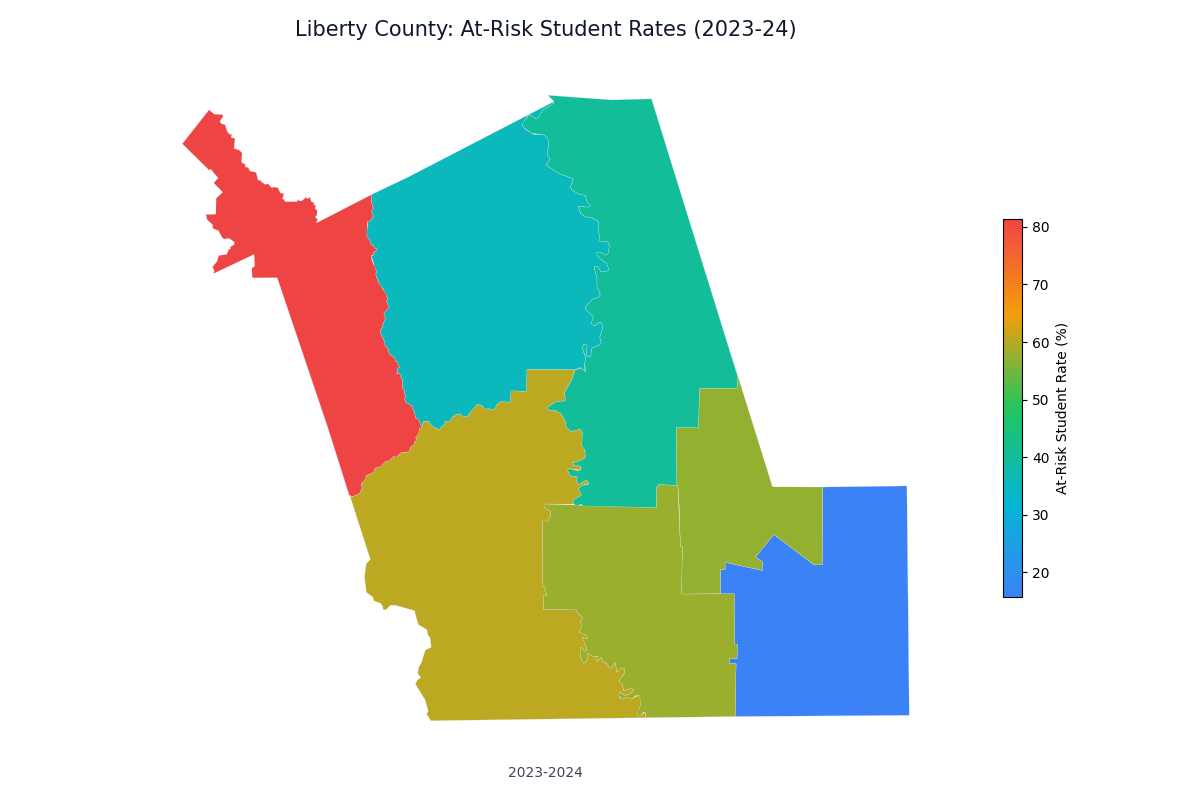
Liberty County: At-Risk Student Rates (2023-24)