Chapter 4E: ARC as Constitutional Remedy
Chapter 4E: ARC as Constitutional Remedy
Analyzes the At-Risk Coefficient (ARC), developed by Kevin Hopper (2025), as a measurement framework for cumulative student risk grounded in TEC §29.081 statutory criteria. Tests whether the post-HB 3 tiered weight (0.225-0.275, statewide average ~0.25, anchored at the 0.20 baseline set by HB 72 in 1984) meets the constitutional standard of an 'efficient system.' Presents three recalibrated regression models (ARC-S Dropout R²=0.45, ARC-S Absenteeism R²=0.31, ARC-P Absenteeism R²=0.44), computes empirically-derived funding weights, and quantifies a statewide funding gap of $1.82 billion. Examines vertical equity through concentration analysis (Spearman ρ=-0.24, Kakwani=0.09) and tests whether TIA incentive funding follows student need. Calls for the 90th Legislature to order an updated Accountable Costs study using the ARC framework.
The Texas compensatory education weight was set at 0.20 by House Bill 72 (68th Legislature, 1984) and restructured by House Bill 3 (2019) to a tiered 0.225 to 0.275 range under TEC §48.104, keyed to census-block poverty. Section 16.151 of HB 72 mandated that the State Board of Education conduct a cost study to determine whether this weight was adequate. The resulting Accountable Costs study (Texas Education Agency & Accountable Costs Advisory Committee, 1986), overseen by Deputy Commissioner Lynn M. Moak, found the 0.20 weight roughly appropriate for the at-risk population as then defined. The committee also recommended increasing the bilingual education weight from 0.10 to 0.26 based on empirical cost analysis. The Legislature never enacted that recommendation. The committee recommended that the state assume responsibility for equalized construction funding. The Legislature created IFA and EDA instead of implementing equalized state funding.
The at-risk definition in 1984 encompassed a narrower population than today's 15 criteria under TEC §29.081(d). Homelessness, foster care, chronic absenteeism, and pregnancy/parenting were not factors in 1984. The student demographic profile has shifted substantially in four decades. No updated cost study has been conducted since 1986, and the 0.20 weight was restructured to a tiered 0.225-0.275 range under TEC §48.104 by HB 3 (2019); adjusted for forty years of inflation, the increase does not close the cost-of-instruction gap.
The At-Risk Coefficient (ARC) was developed by Kevin Hopper (2025) as a campus-level measure of cumulative student risk, allowing a comparison across campuses in order to guide resource allocation decisions locally. Initial factor weights were drawn from a meta-analysis of school absenteeism and dropout risk factors (Gubbels, van der Put, & Assink, 2019). ARC weights each risk factor through a regression with the outcome of interest, unlike the simple at-risk percentage, which counts any student meeting at least one of the 15 statutory criteria without distinguishing between a campus where 60% of students face one risk factor and a campus where 60% face four compounding factors. Eight risk factors map to 12 of the 15 TEC §29.081 criteria. Five criteria are excluded because TEA does not report campus-level aggregate counts in its standard reporting (parole/probation, prior dropout, residential placement, incarceration, and dropout recovery enrollment).
To test whether the meta-analysis weights hold for Texas, Ordinary Least Squares (OLS) regression models were calculated using 2023-24 campus-level PEIMS data. The elementary model (N = 4,594, R² = 0.40) identifies economic disadvantage (β* = 0.40) and academic underperformance (β* = 0.36) as dominant predictors of chronic absenteeism. The middle school model (N = 1,664, R² = 0.46) finds academic underperformance (β* = 0.34) and discipline/DAEP placement (β* = 0.33) as co-dominant predictors. At middle school, discipline reaches β* = 0.33. The high school model (N = 1,565, R² = 0.32) finds academic underperformance at β* = 0.45, to be the largest single predictor of chronic absenteeism at any school level. A dropout model was also tested for high school (N = 2,087, R² = 0.45). It produced wrong-sign coefficients. Economic disadvantage came back at β* = -0.034, not significant, predicting lower dropout after controlling for other factors. The problem is the data, not the model. 780 of 2,087 campuses (37.4%) report exactly 0.0% dropout because FERPA suppresses any count below 10, flooding the distribution with artificial zeros.
An unmasked validation using Austin ISD Student Information System data (108 campuses, 2024-25, 0% FERPA masking) tested the three-bucket model. Elementary R² rose from 0.40 to 0.73. Middle school R² rose from 0.46 to 0.74. High school R² rose from 0.32 to 0.89 using a reduced 3-predictor model, because the full model had too few high schools (N = 12) to support all predictors. FERPA masking accounts for the gap between statewide and AISD model performance. A statewide ARC computed from unmasked PEIMS data would approach the AISD performance levels.
The regression analysis reveals relative variation in need across districts. A campus with high risk factor concentrations generates a larger predicted outcome value, indicating greater compensatory need at the campus. The funding weight for each district is calculated as the ratio of its predicted compensatory need to its basic allotment enrollment. The statewide distribution of these empirical weights reveals the highest-need districts require empirical weights 2 to 3 times the frozen statutory value. Standardized beta coefficients (standardized betas) allow comparison of relative predictor importance across factors measured on different scales. R² measures how much the whole model explains. The statewide models land between 0.40 and 0.46. With unmasked Austin ISD data, the same models reach 0.73 to 0.89. Economic disadvantage (β = 0.40 at elementary) and academic underperformance (β = 0.36) carry nearly identical weight in predicting chronic absenteeism. TEC §48.104 treats them as if they are unrelated. A campus where 90% of students qualify for free lunch and 60% are chronically absent receives the same 0.20 multiplier as a campus where 60% qualify for free lunch and 8% are chronically absent. The multiplier does not adjust for compounding risk.**
Spearman's rho tests whether districts with higher ARC scores also receive more per-pupil funding. They do not. ρ = -0.24 (p < 0.001, n = 1,192 districts). The Concentration Index sits at 0.27, meaning per-pupil funding pools among lower-need districts rather than tracking proportionally with need. The Kakwani Index, calculated by subtracting the Gini coefficient of need from the Concentration Index, comes to 0.09. At 0.09, the funding distribution is more unequal than the need distribution itself. All three point the same direction. A Spearman of ρ = -0.24 (p < 0.001, n = 1,192 districts) shows higher-risk districts receive less per-pupil funding. A Concentration Index of 0.27 indicates funding concentrates among lower-need districts. A Kakwani Index of 0.09 reveals the funding distribution is more unequal than the need distribution (Texas Education Agency, 2024). The statewide funding gap between the post-HB 3 tiered weight (0.225-0.275, statewide average ~0.25, anchored at the 0.20 baseline set by HB 72 in 1984) and empirically derived weights totals $1.82 billion. The highest-ARC districts receive no additional recognition for compounding risk burdens. The TIA analysis from Section 4B shows that incentive funding compounds the problem.
SQ4 asked whether the ARC model provides a constitutionally adequate alternative to the post-HB 3 tiered weight (0.225-0.275, statewide average ~0.25, anchored at the 0.20 baseline set by HB 72 in 1984). The three-bucket regression produces empirical weights responsive to campus-level variation in cumulative risk. The 1986 Accountable Costs committee established the precedent that empirical evidence should drive compensatory weights. The data presented here provides the measurement framework the next cost study requires. Determining the actual dollar cost of mitigating each risk factor requires a legislative cost study, the approach the 1986 committee recommended, and the requirement that HB 3 eventually removed from statute. The ARC model identifies where the need is greatest and quantifies how much it varies across the district, the campus, or even the student level. Current statute underfunds the regression-derived allotment by $1.82 billion statewide.
Figure 9. ARC: Meta-Analysis vs. Texas Middle School Regression Weights
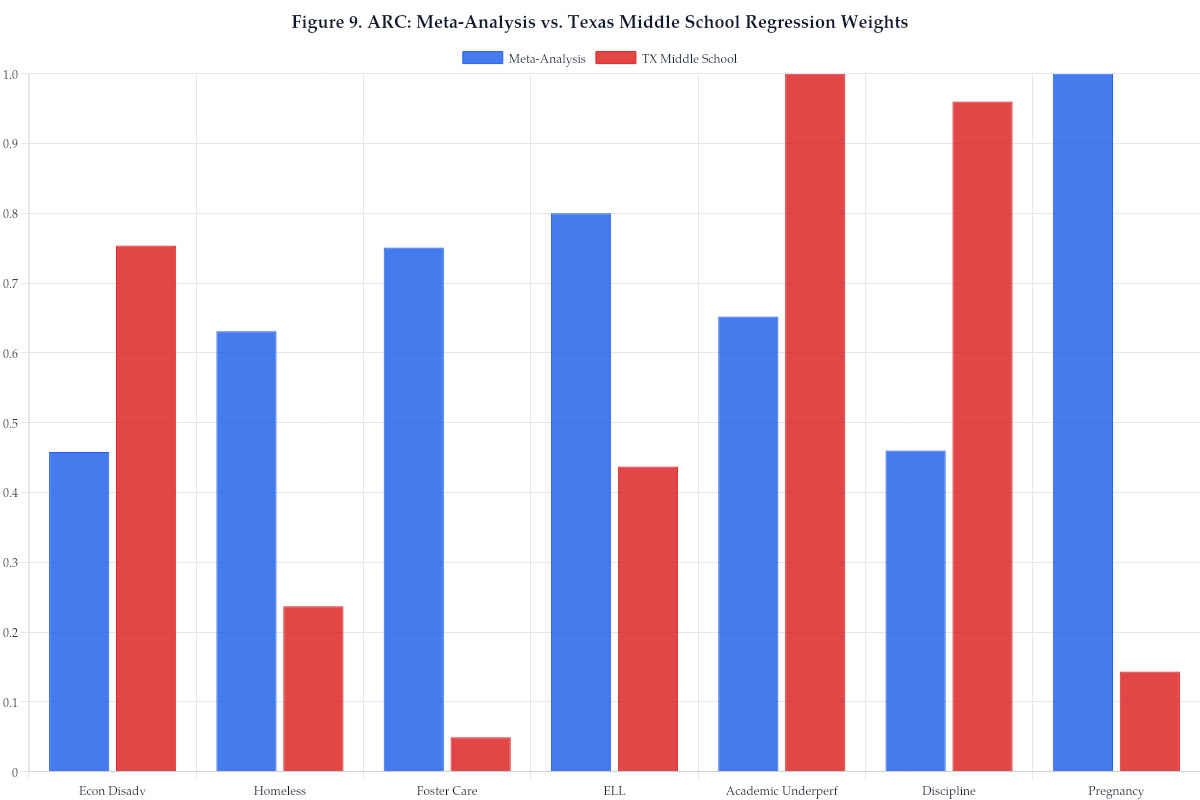
Figure 9b. ARC: Meta-Analysis vs. Texas High School Regression Weights
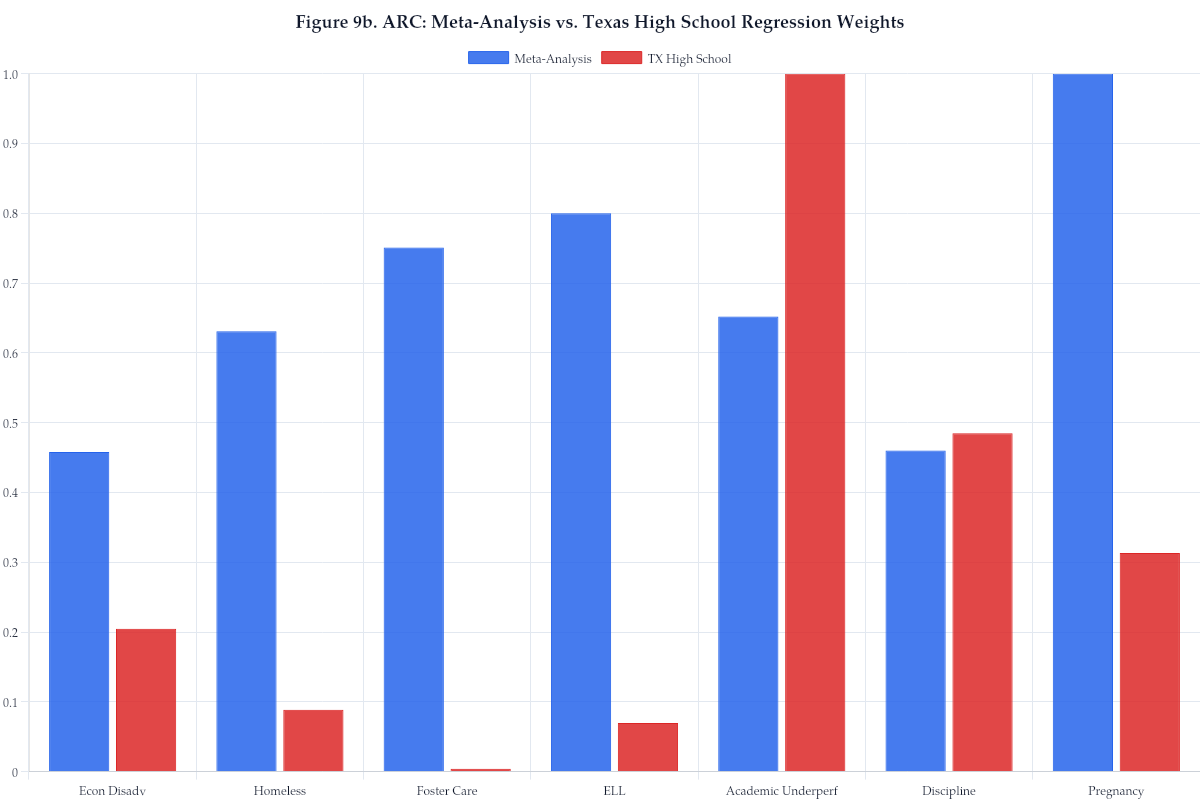
Figure 10. ARC: Meta-Analysis vs. Texas Elementary Weights
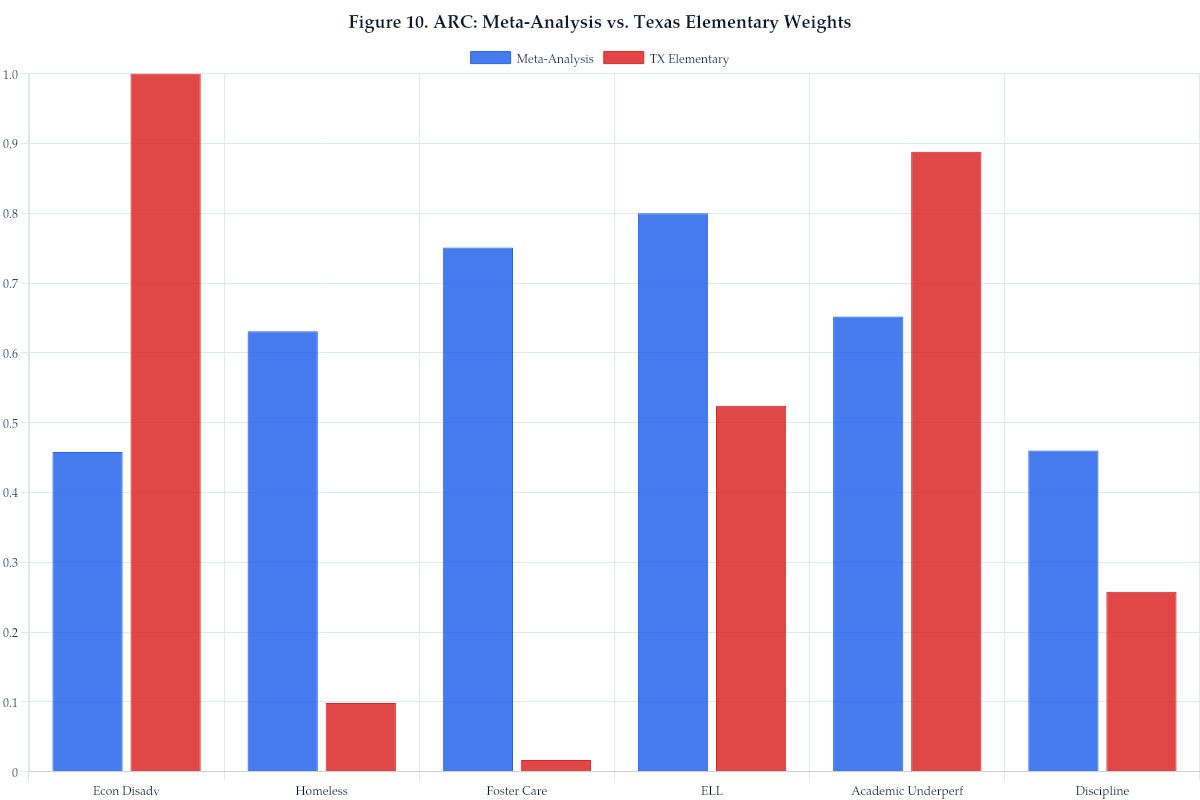
Figure 11. Statewide Distribution of Blended District ARC Scores
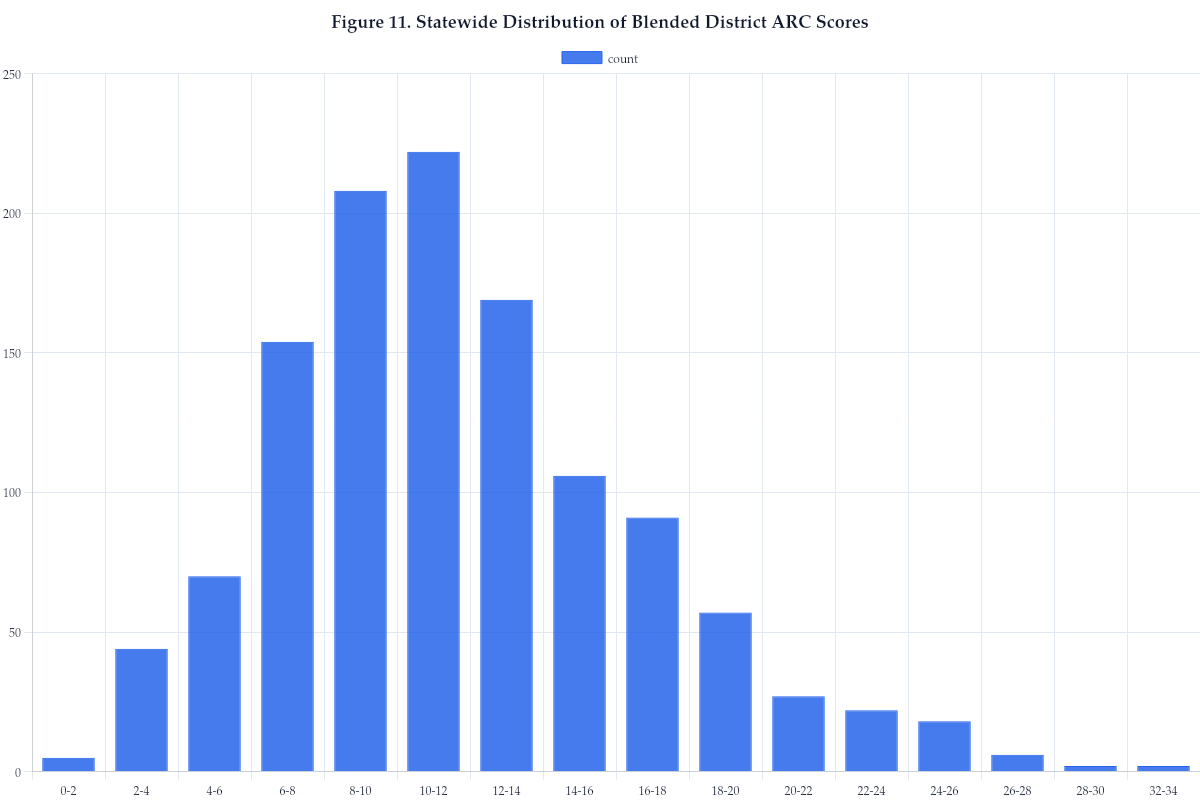
Figure 12. Top 25 Districts by Blended ARC Score
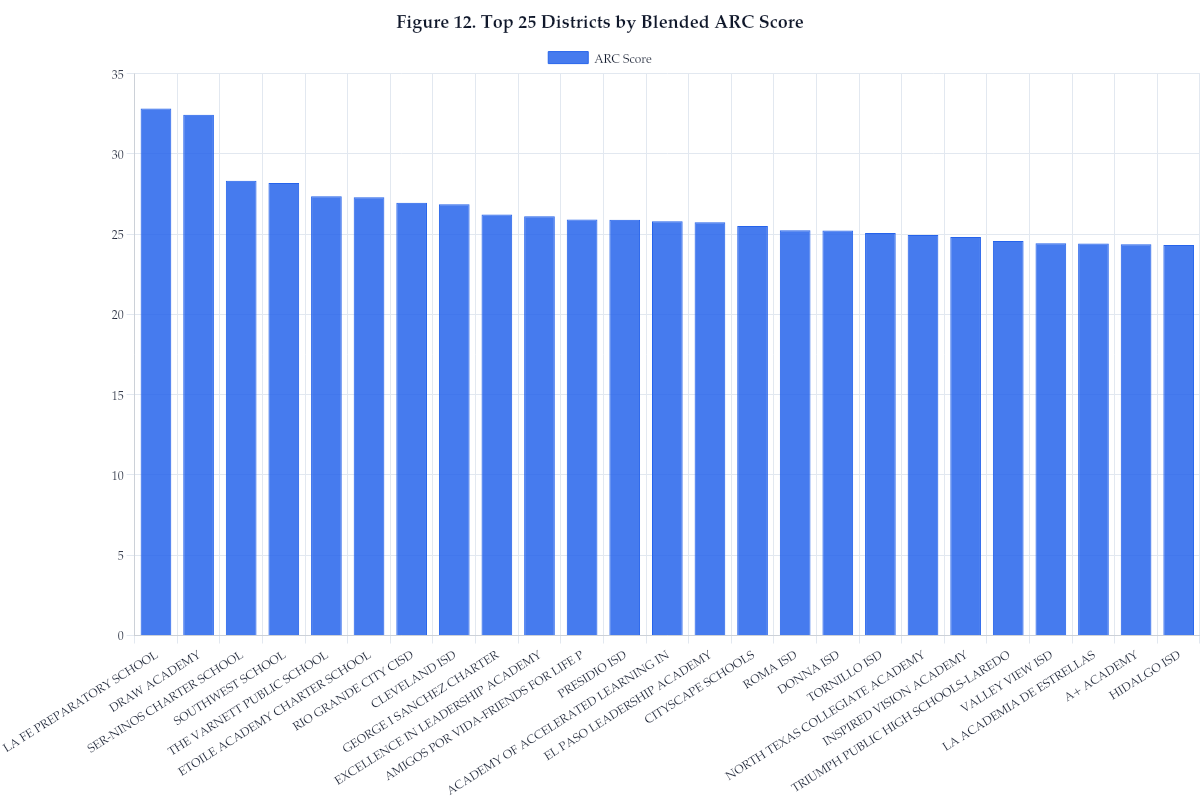
Figure 13. ARC Score vs. Simple At-Risk Percentage
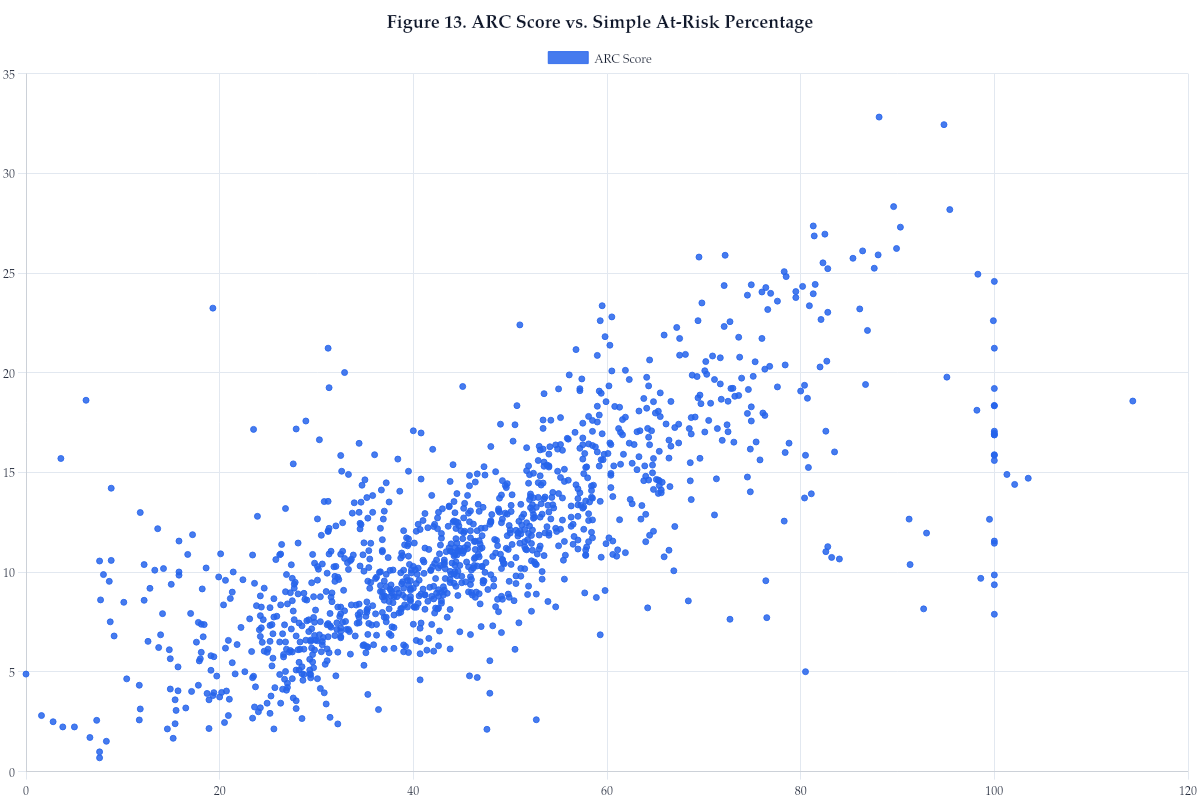
Figure 15a (part 1). Statewide ARC Score by District (2023-24)
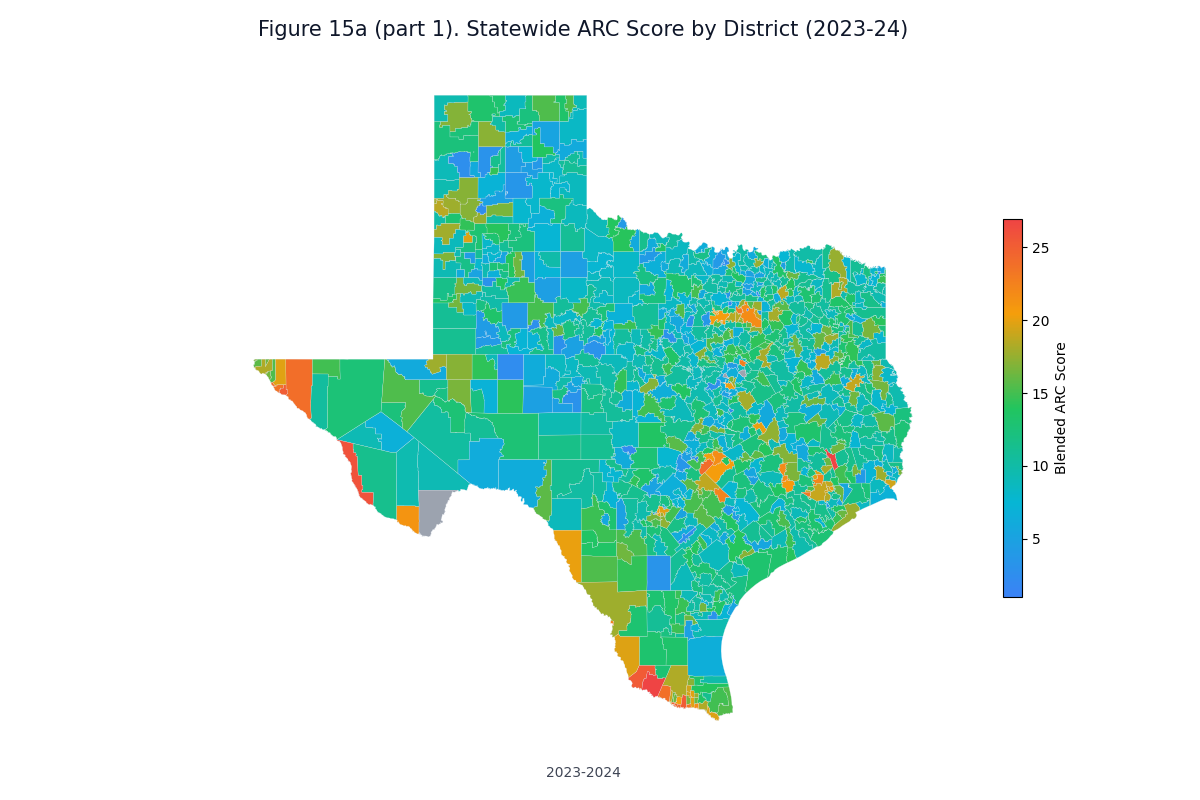
Figure 15a (part 2). Statewide Per-Pupil Operational Expenditure by District (2023-24)
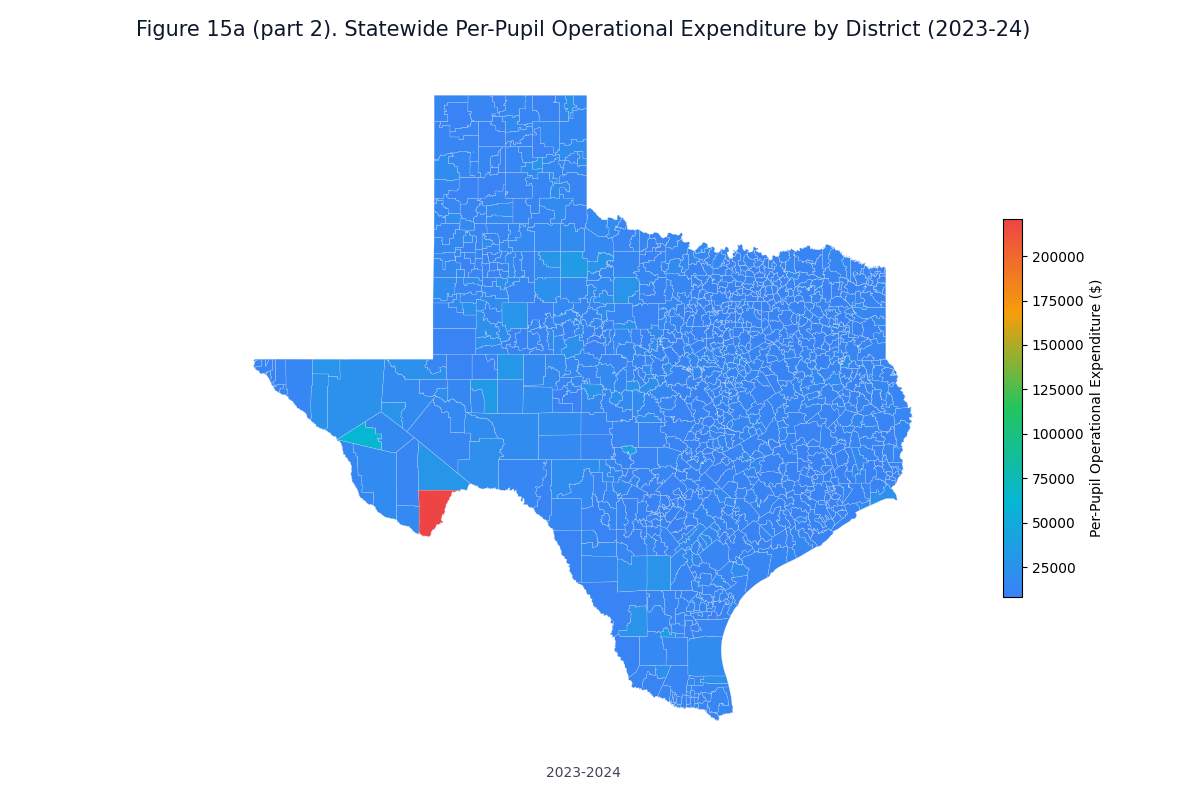
Figure 15c. Funding-Need Alignment Indicators (2023-24)
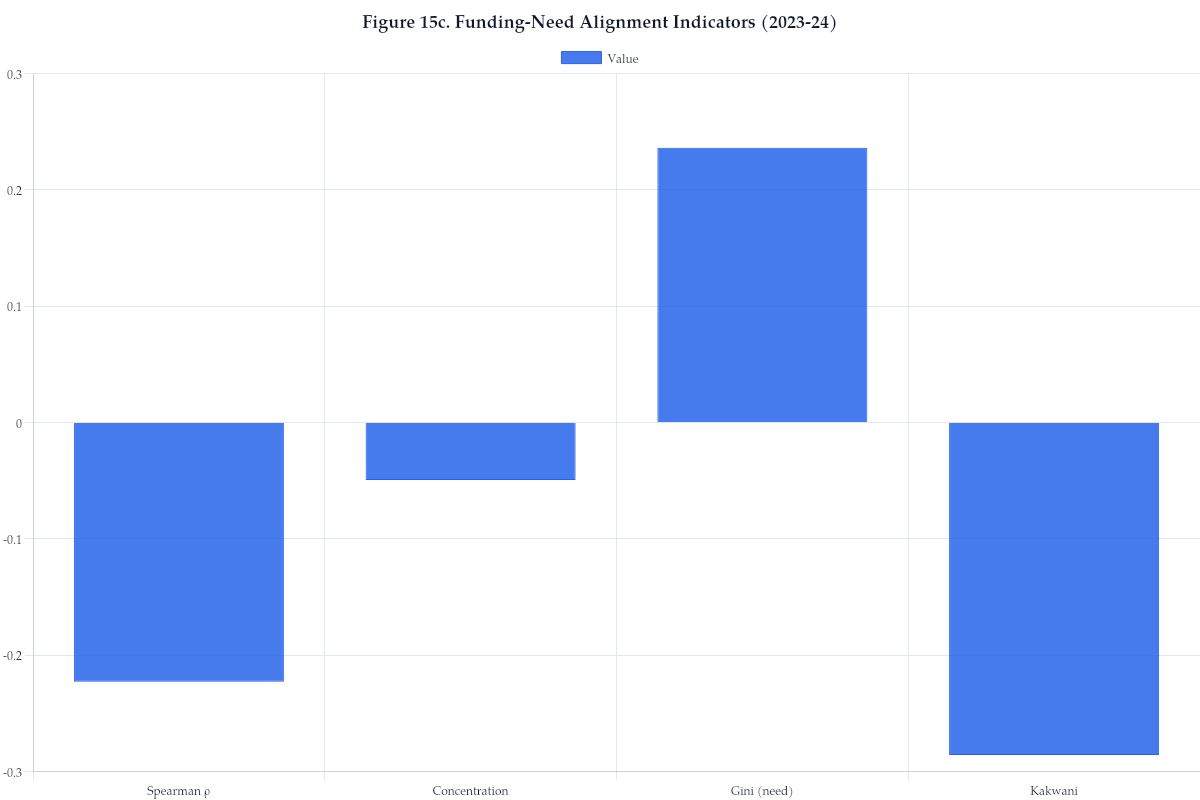
Figure 14. Proposed Funding Weights vs. Frozen Statutory Weight
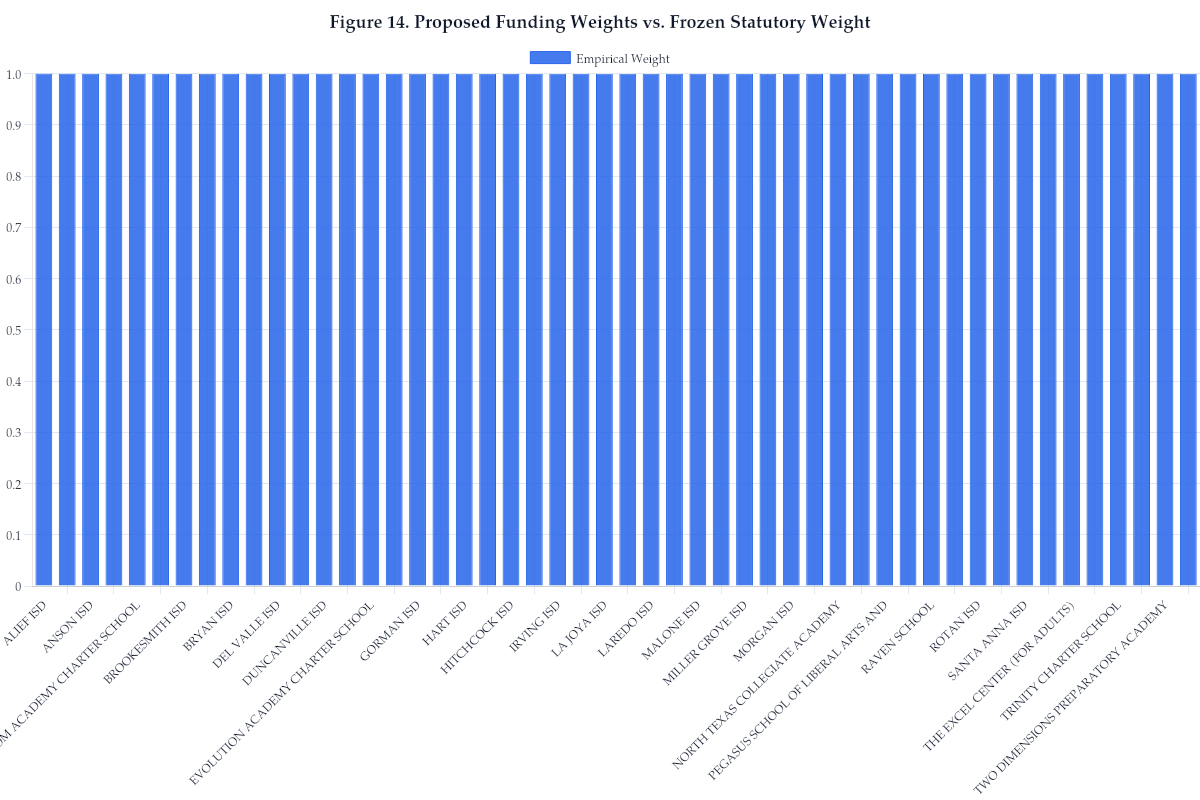
Figure 15. Funding Gap: Top 20 Most Underfunded Districts
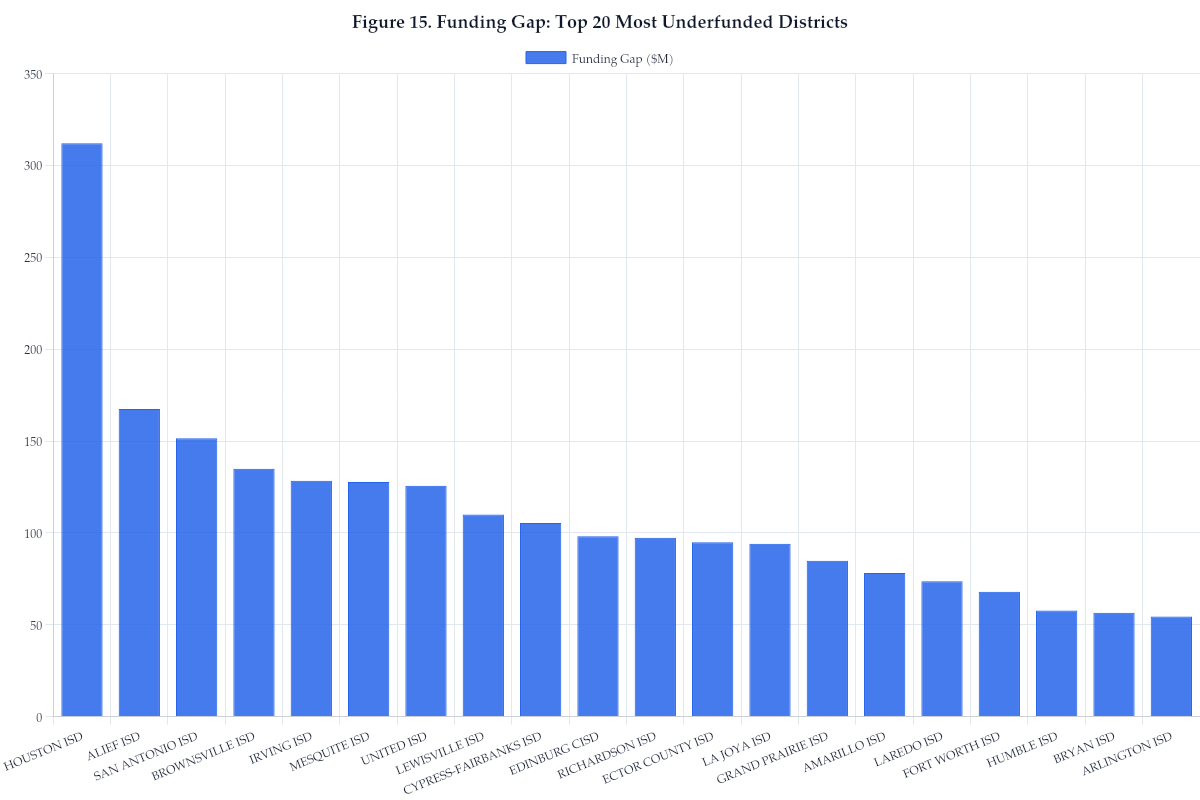
Figure 15a. Funding Gap Per Pupil: Top 20 Most Underfunded Districts
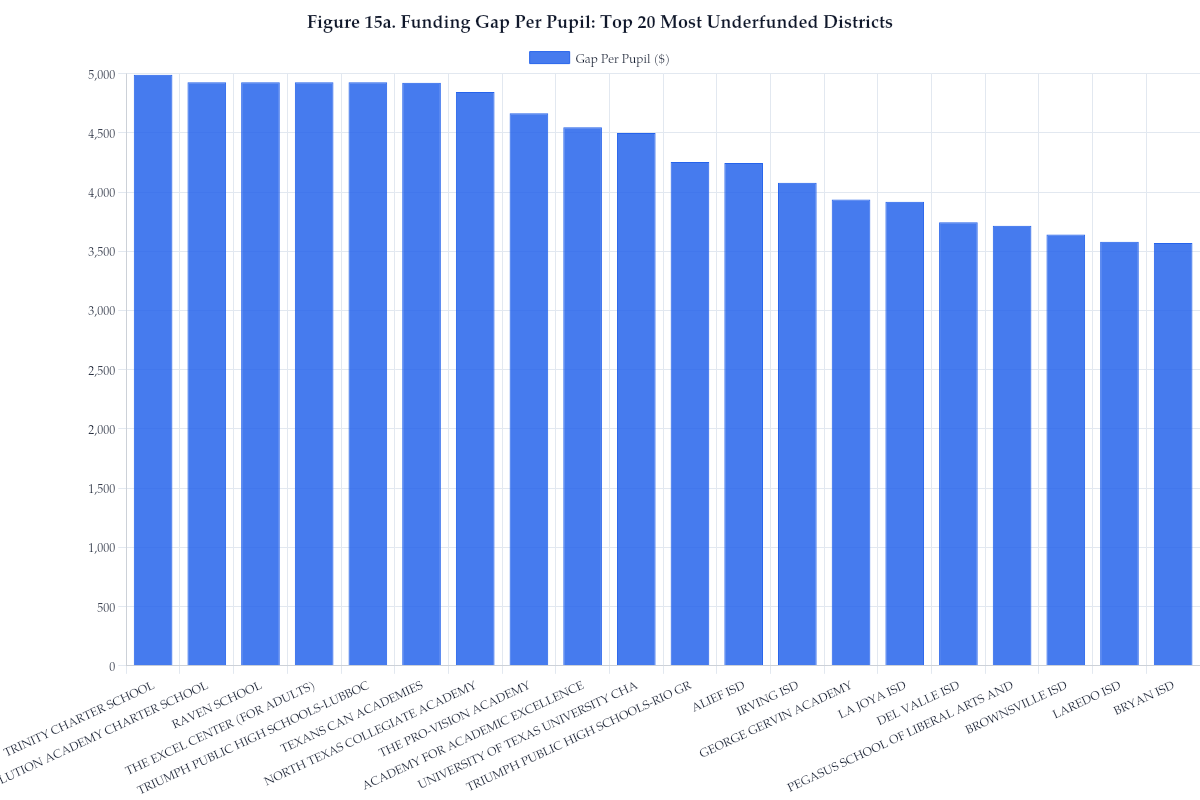
Figure 16. Case Study Districts: Statutory vs. Regression Allotment
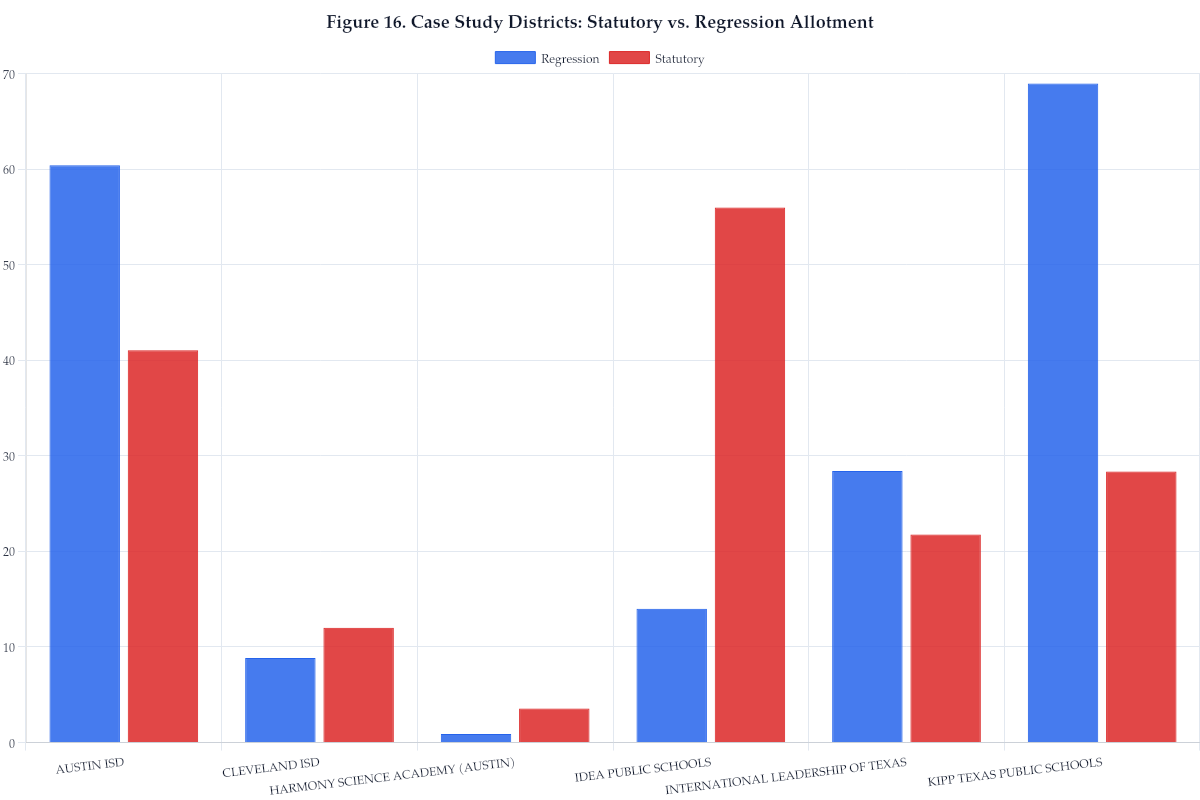
Figure 17. Cleveland ISD vs. ILTexas: Campus ARC Scores
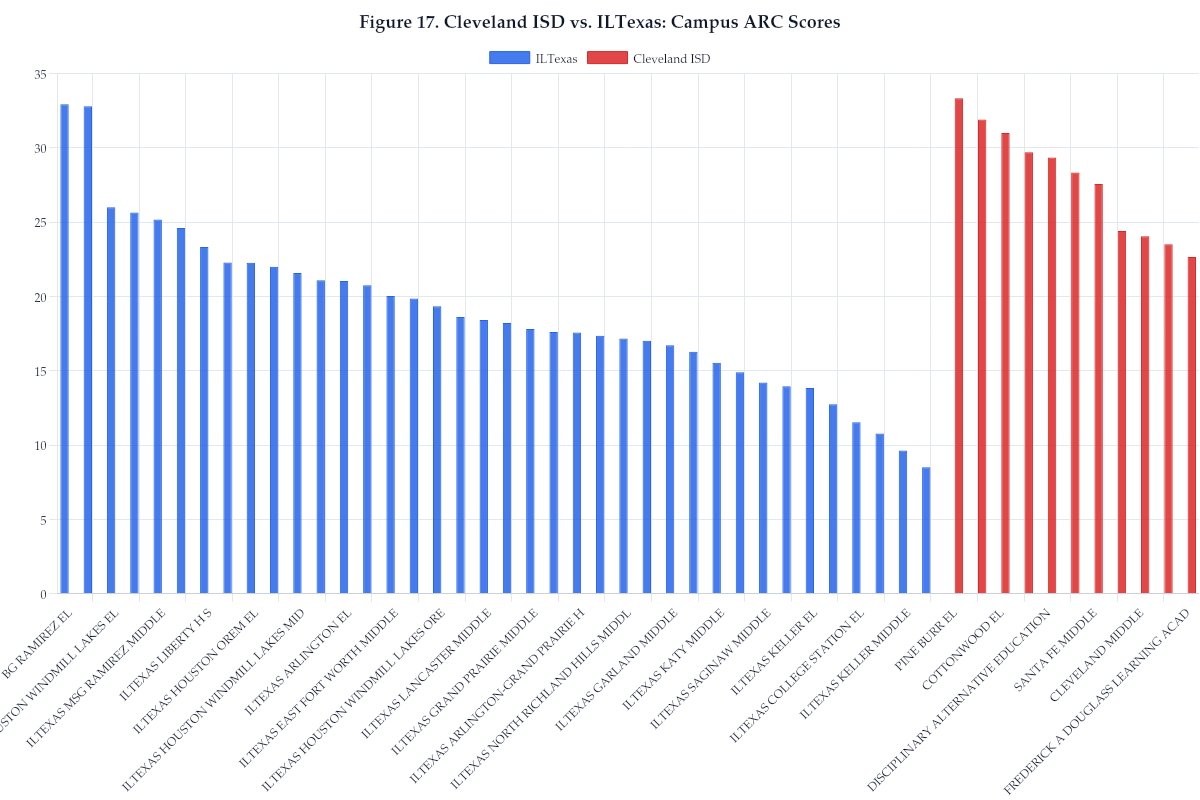
Figure 18. Austin Area: ISD vs. Charter Network ARC Comparison
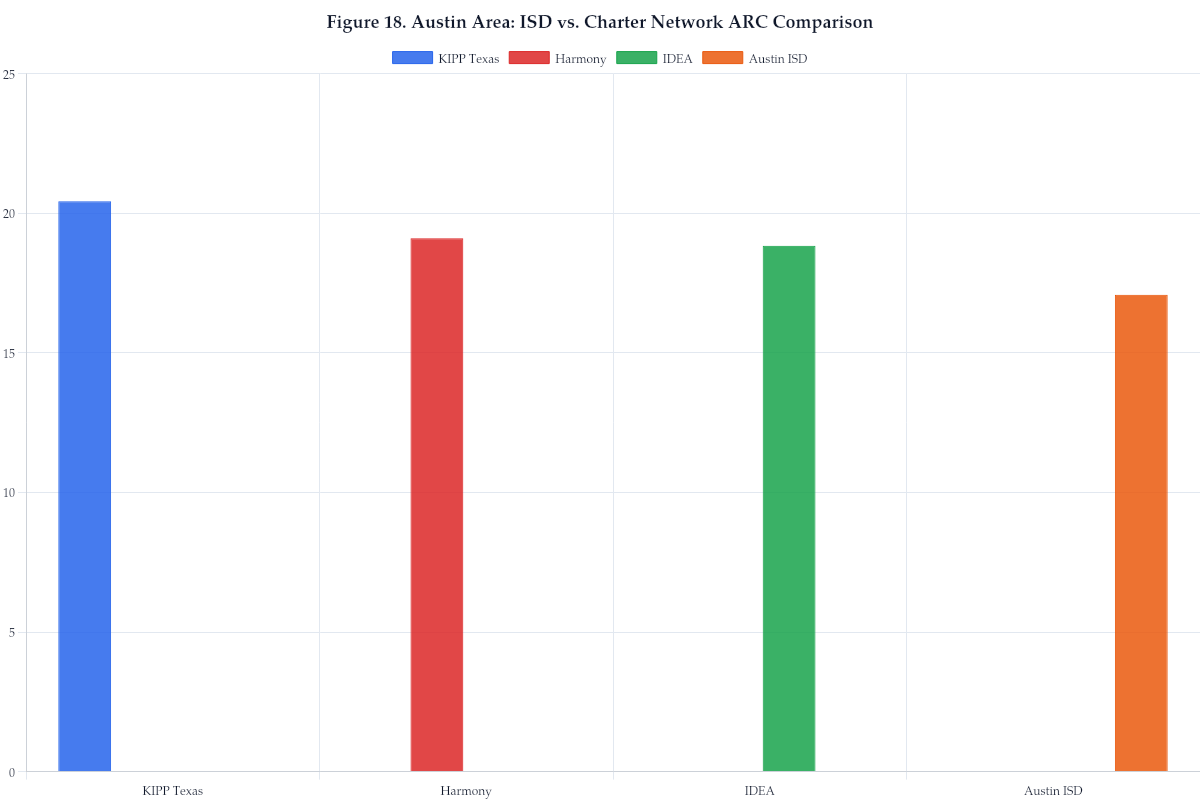
Figure 18a. Austin Area Campus-Level ARC Scores by Network and Overlap Zone
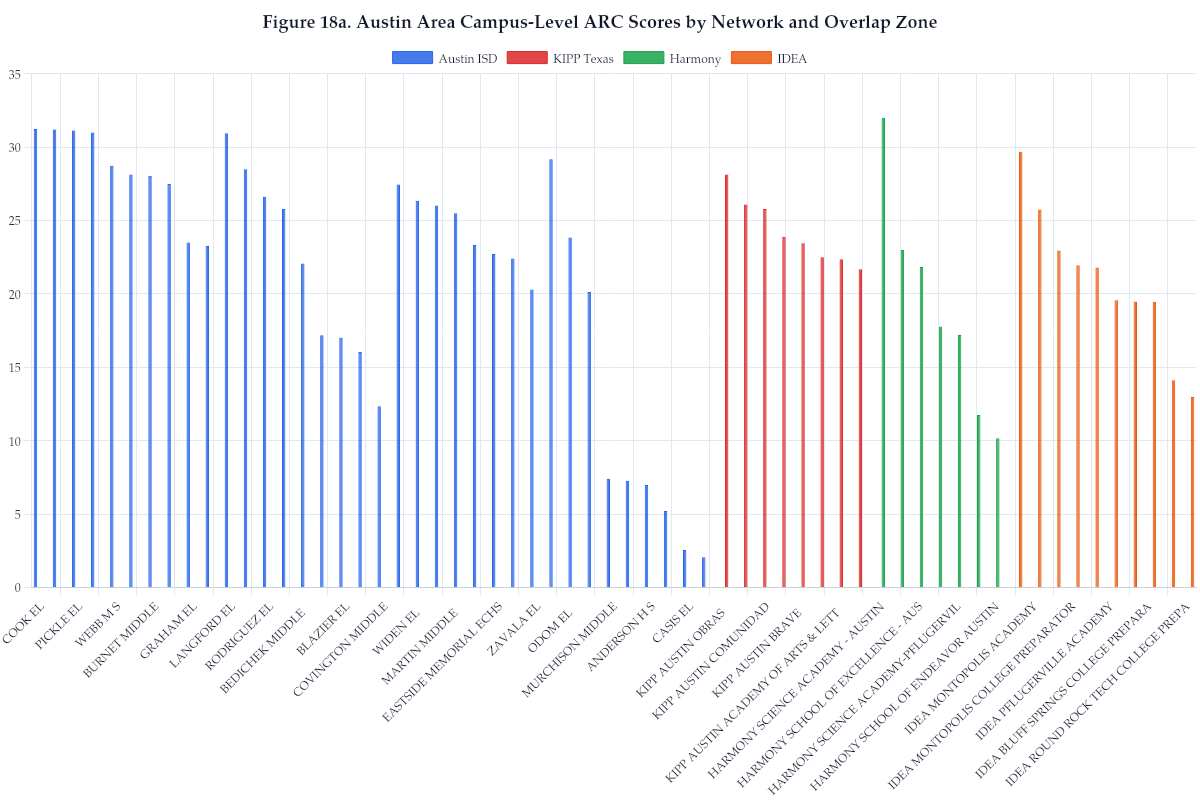
Figure 19. Pregnancy/Parenting Risk: 9-Year Longitudinal Trend
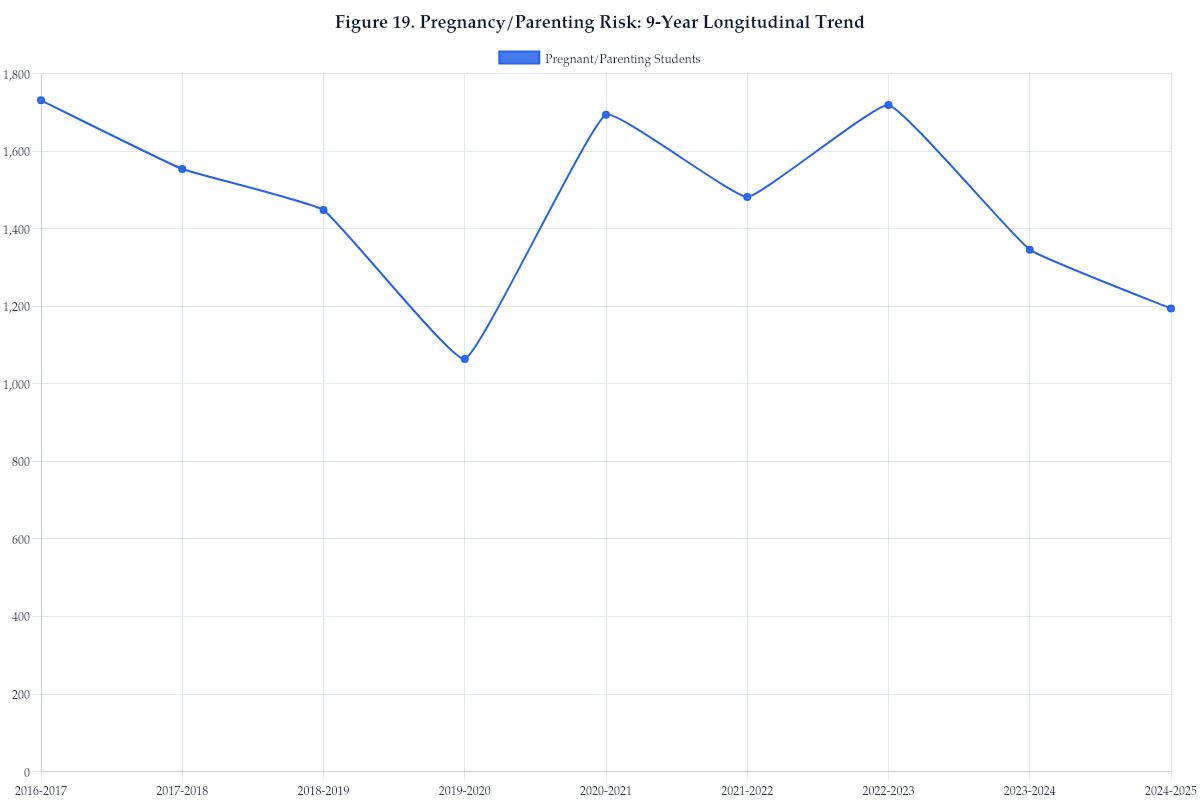
Figure 20. Funding Concentration Curve
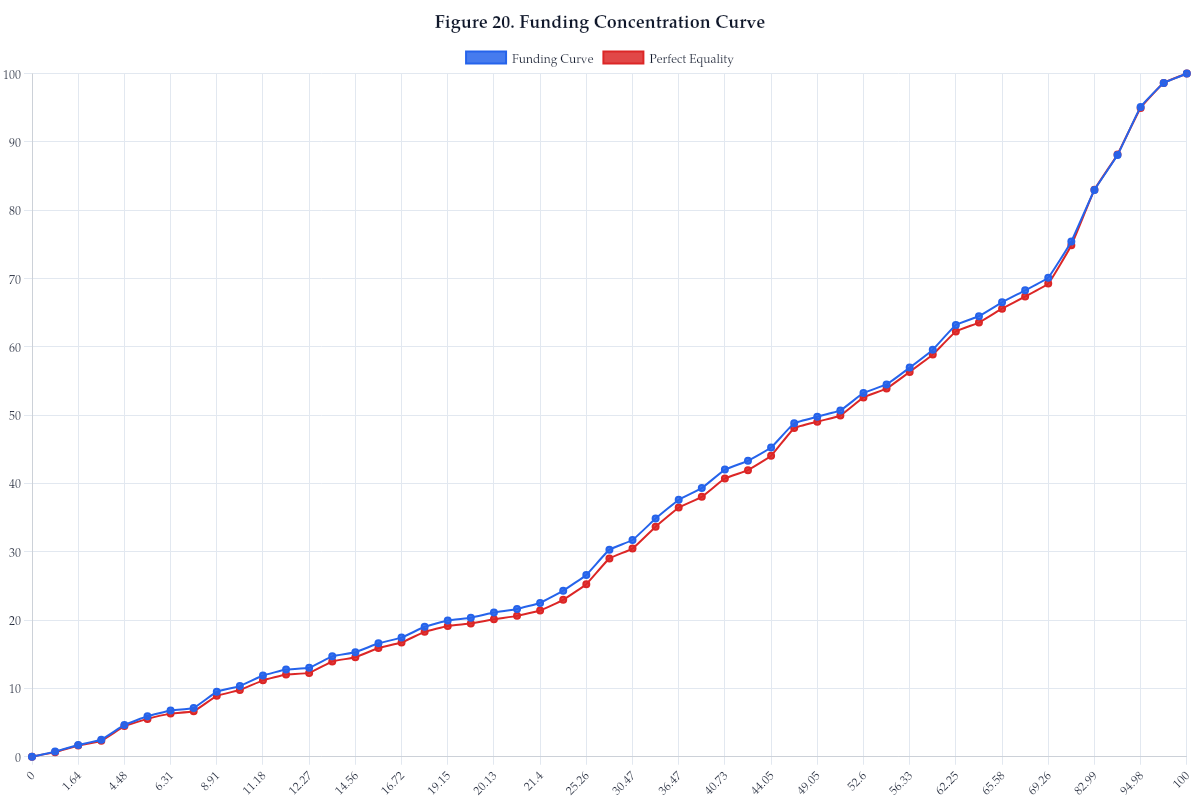
Figure 22. TIA Participation Rate by ARC Quartile (Middle and High School)
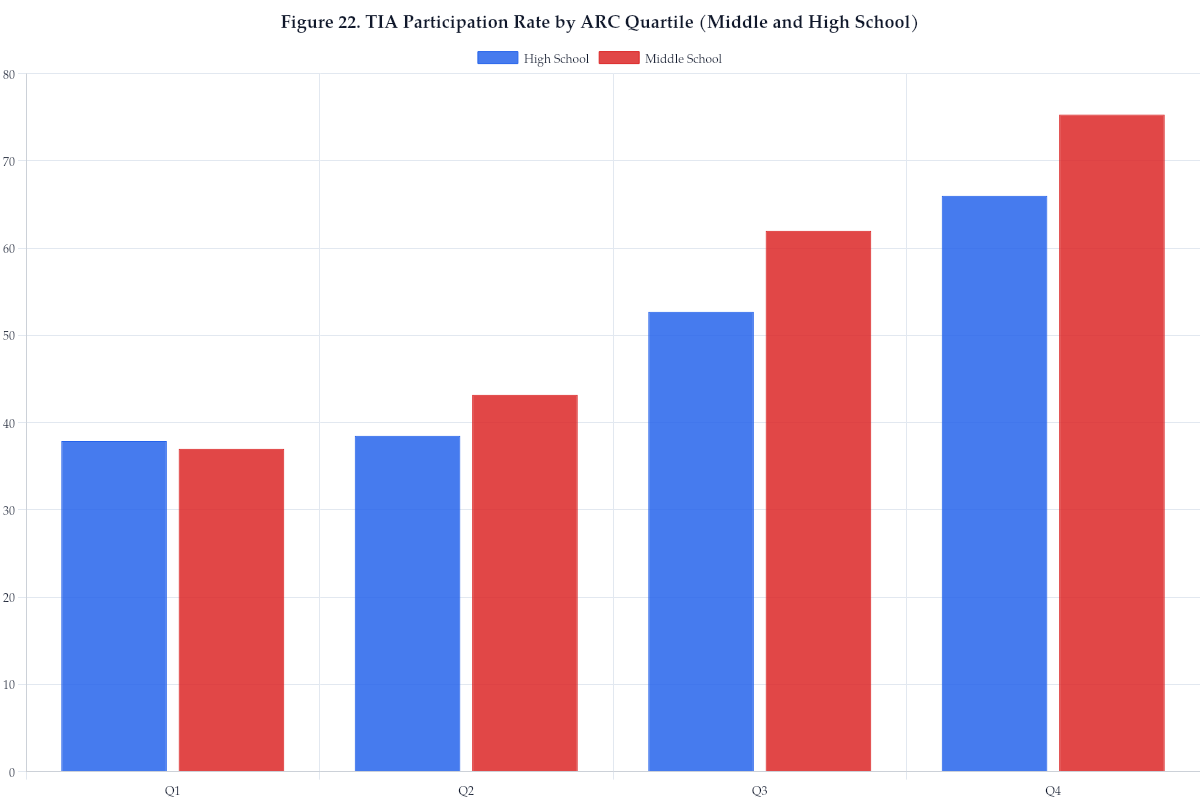
Figure 23. TIA Allotment per Student by ARC Quartile (Middle and High School)
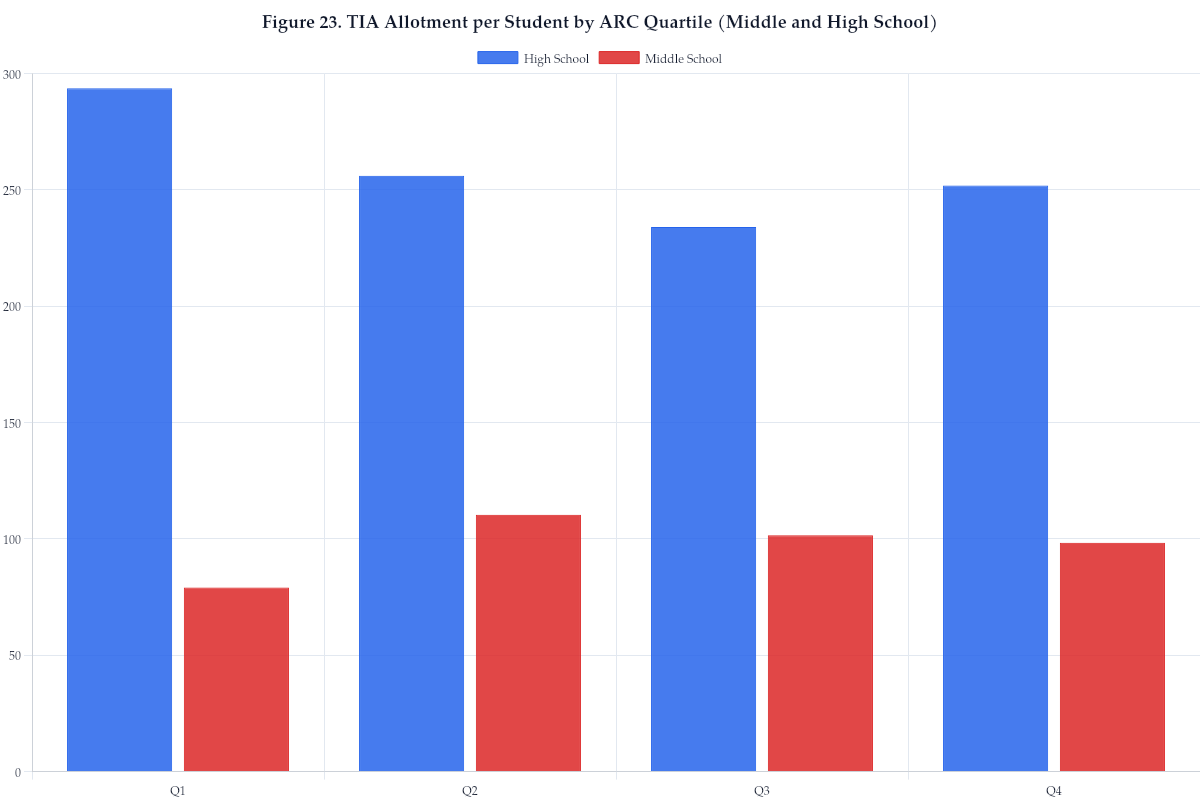
Figure 24. TIA Participation: Charter vs. ISD by ARC Quartile (Middle and High School)
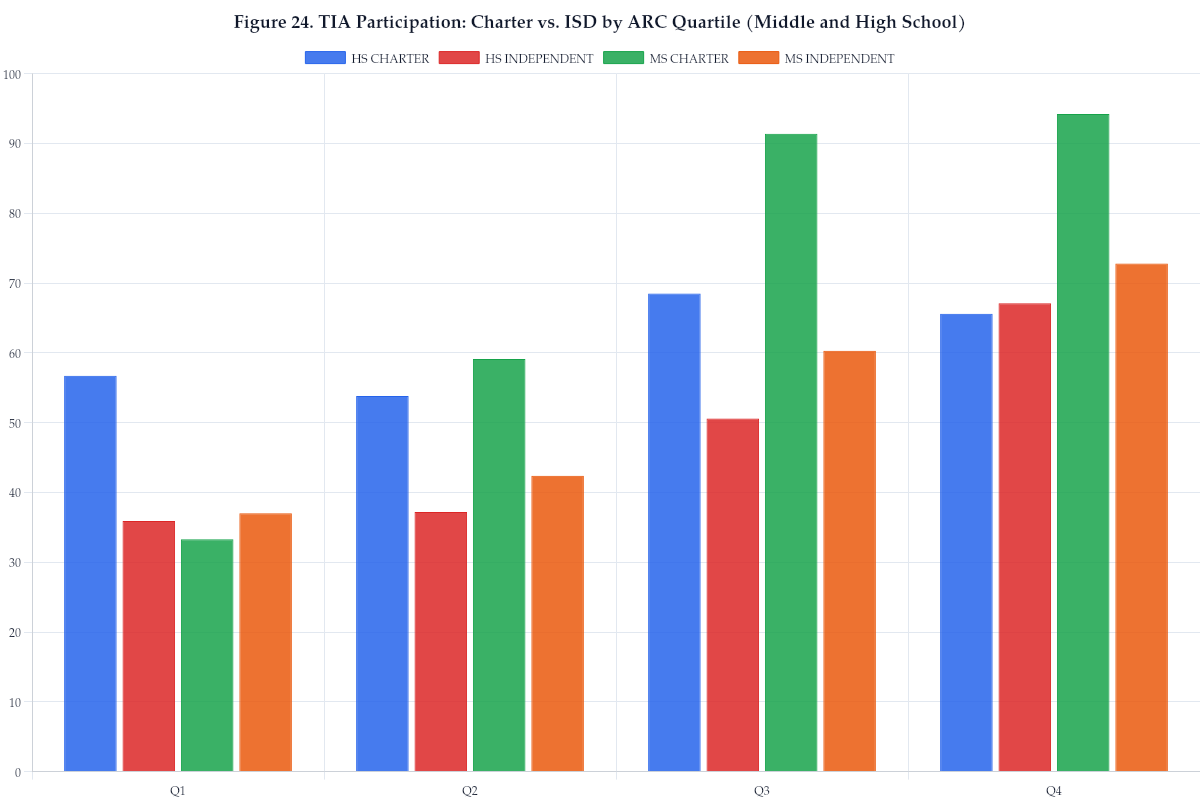
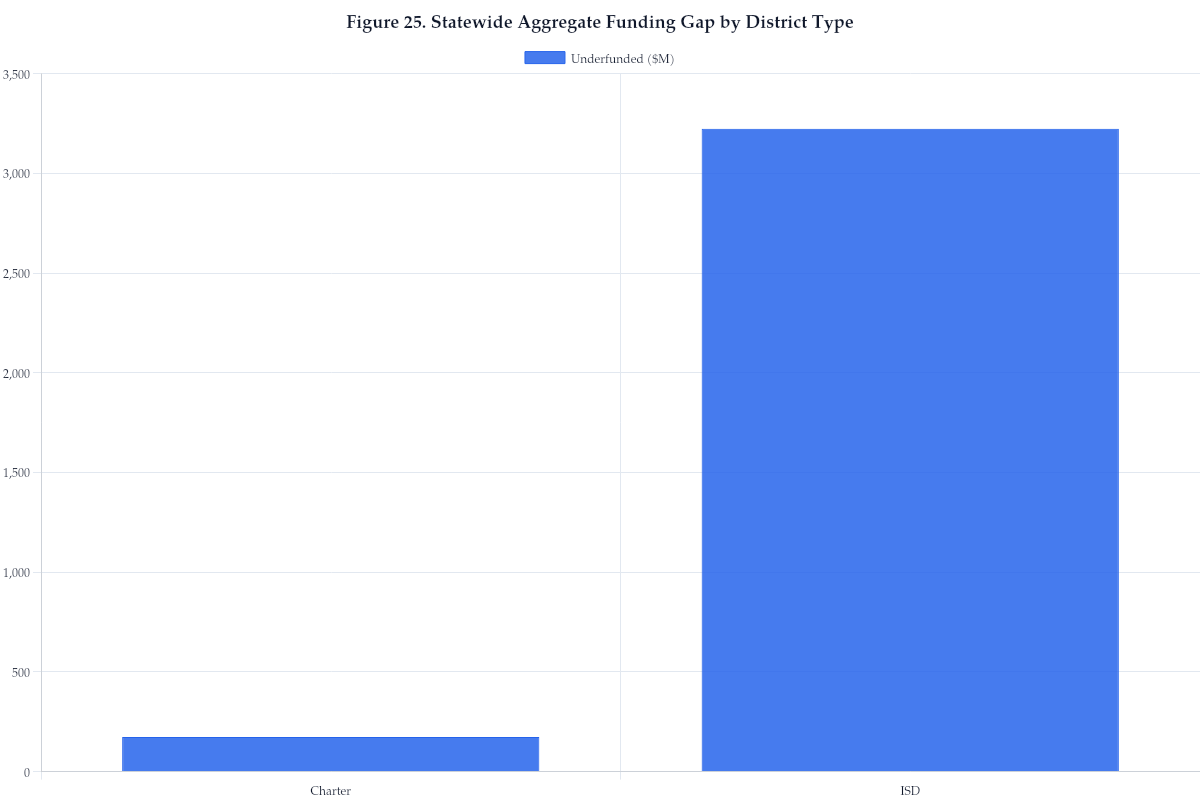
Figure 25. Statewide Aggregate Funding Gap by District Type
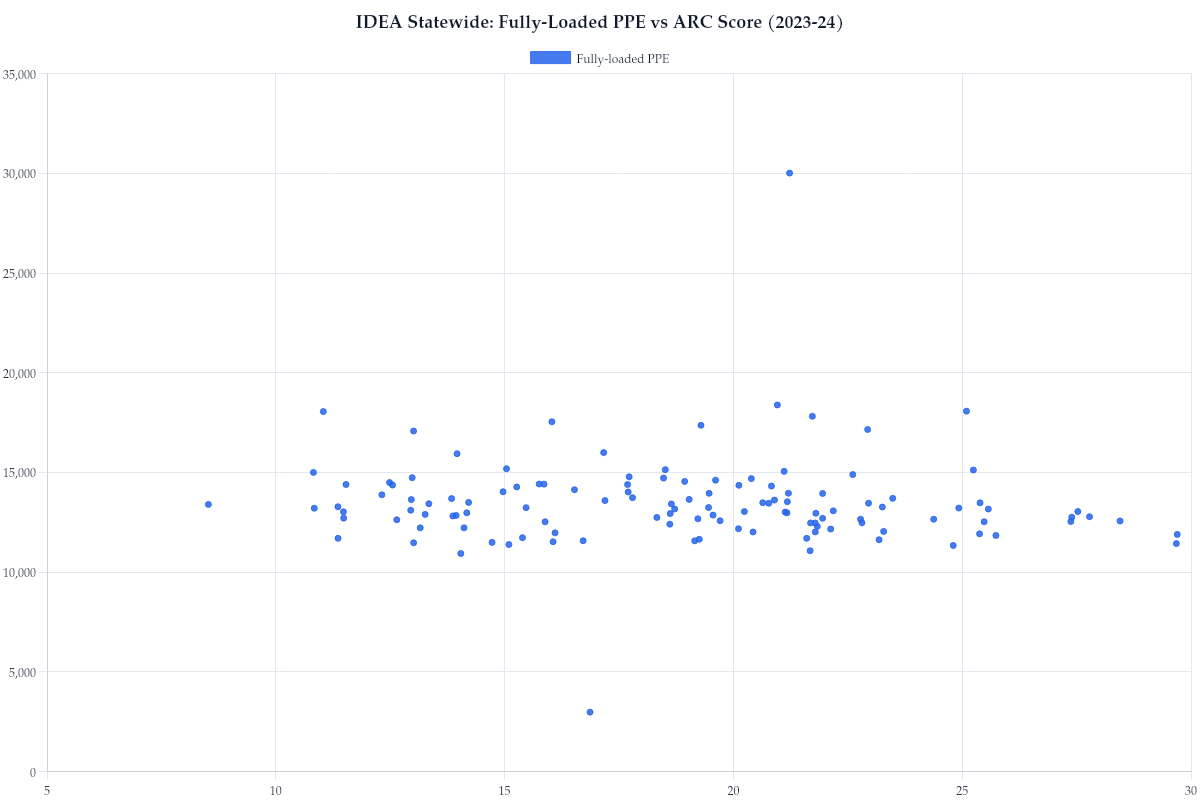
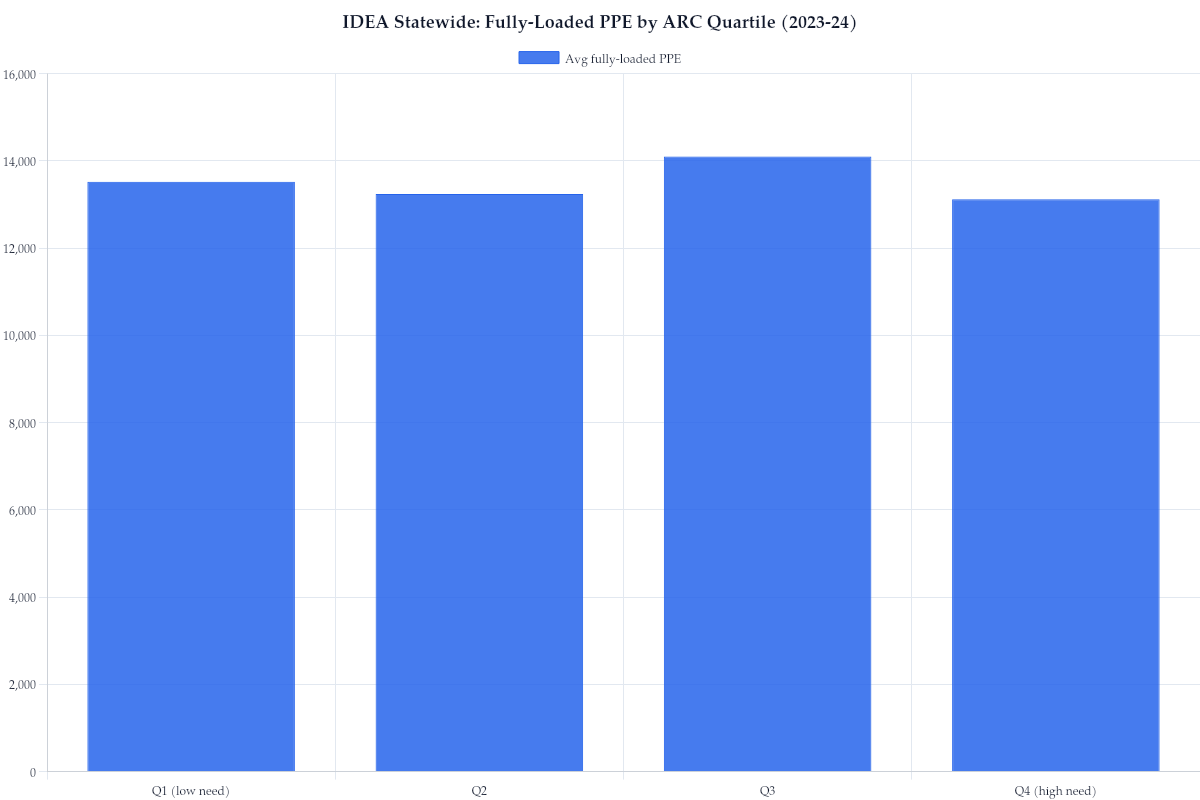
IDEA Statewide: Fully-Loaded PPE by ARC Quartile (2023-24)
IDEA Statewide: Fully-Loaded PPE vs ARC Score (2023-24)